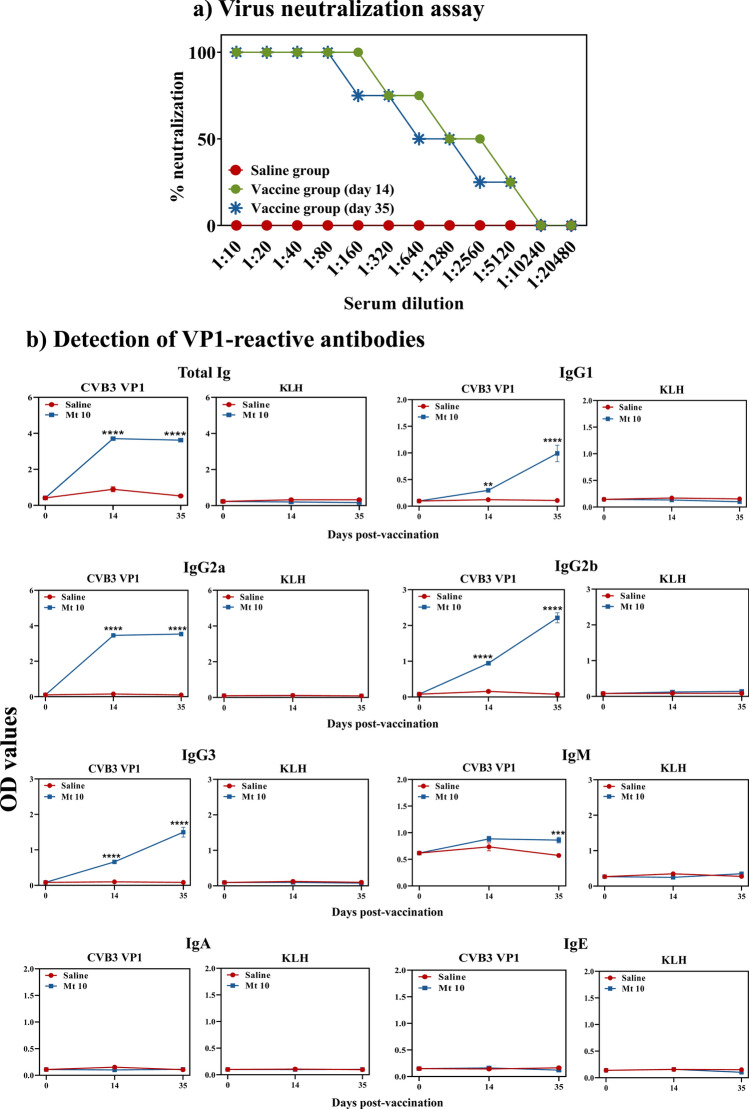
Figure 5.
Mt 10 virus induces neutralizing antibodies of IgG isotypes. (a) Virus neutralization assay. Sera were obtained from saline and Mt 10 virus groups on days 14 and 35, and after diluting serially, samples were incubated with wt CVB3. The mixtures were transferred to plates containing Vero cells, and incubation was continued for four days to calculate the percentage neutralization based on CPE. Data from n = 6 samples, each representing a pool of sera from 3 to 5 mice, are shown. (b) Detection of VP1-reactive antibodies. Serum samples collected from the above groups were diluted (1:150) and added in duplicates to high-binding plates previously coated with CVB3-VP1 or KLH (control). After adding HRP-conjugated goat anti-mouse total Ig, IgG1, IgG2a, IgG2b, IgG3, IgM, IgA, and IgE as detection antibodies, reactions were stopped. Plates were read at 450 nm to obtain the OD values. Mean ± SEM values obtained from n = 6 samples, each representing 3 to 5 mice, are shown. Mann–Whitney test was used to determine significance between groups. **p ≤ 0.01, ***p ≤ 0.001, and ****p ≤ 0.0001.

