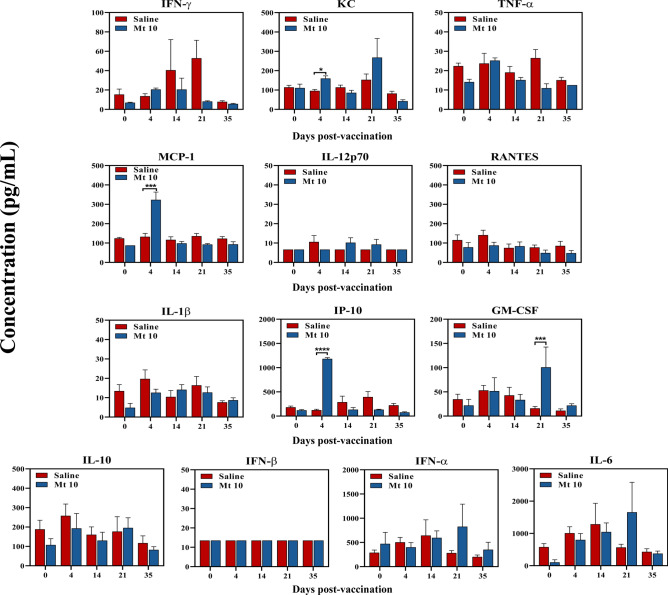
Figure 7.
Analysis of anti-viral cytokines and chemokines in response to Mt 10 virus. Groups of mice were administered with saline or Mt 10 virus, and sera were collected periodically from day 0 to day 35. Samples were processed for a panel of indicated anti-viral cytokines and chemokines by LEGENDplex cytokine bead array as described in the methods section, and their levels were compared. Mean ± SEM values obtained from three individual experiments, each involving n = 3 to 8 mice are indicated. Unpaired Student’s t-test (two-tailed) was used to determine significance between groups. *p ≤ 0.05, ***p ≤ 0.001, and ****p ≤ 0.0001.

