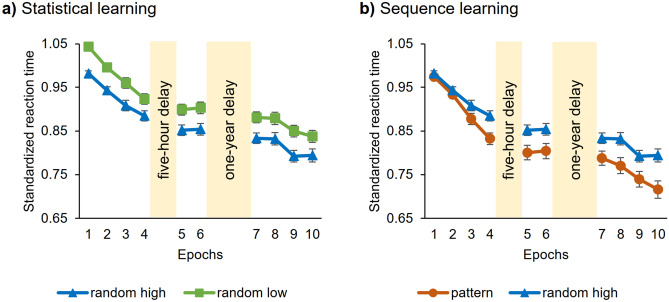
Figure 2.
Temporal dynamics of (a) statistical and (b) sequence learning across epochs and sessions. Standardized RT values as a function of the epoch (1–10) and trial types (random high vs random low for statistical learning and pattern vs random high for sequence learning) are presented. Blue lines with triangle symbols indicate standardized RT values on the random high trials, green lines with square symbols indicate standardized RT values on the random low trials and orange lines with circle symbols indicate standardized RT values on the pattern trials. (a) Statistical learning is quantified by the gap between blue and green lines and (b) sequence learning is quantified by the gap between orange and blue lines. In both cases, greater gap between the lines represents better learning. Error bars denote standard error of mean.

