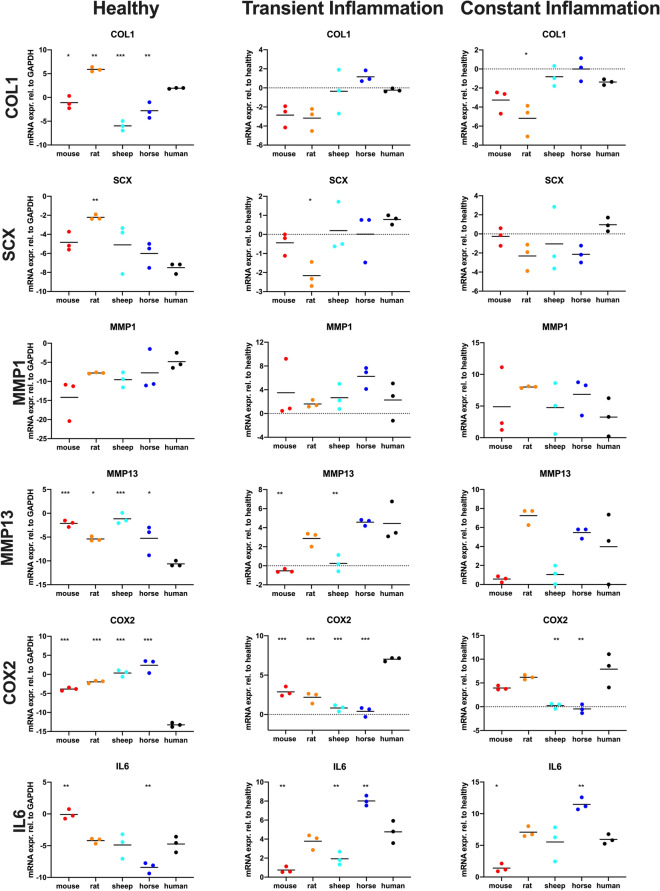
Figure 4.
Scatter dot plots showing COL1, SCX, MMP1, MMP13, COX2 and IL6 gene expression (presented as log2) of healthy tenocytes and tenocytes exposed to inflammatory stimuli for 24 h (transient inflammation) or continuously (constant inflammation) in different species (the black lines indicate the respective means). Gene expression in the inflammatory conditions is shown relative to the healthy tenocytes. Each dot represents a different biological replicate. Differences were evaluated using ANOVA with Tukey HSD test, *p < 0.05; **p < 0.01; ***p < 0.001.

