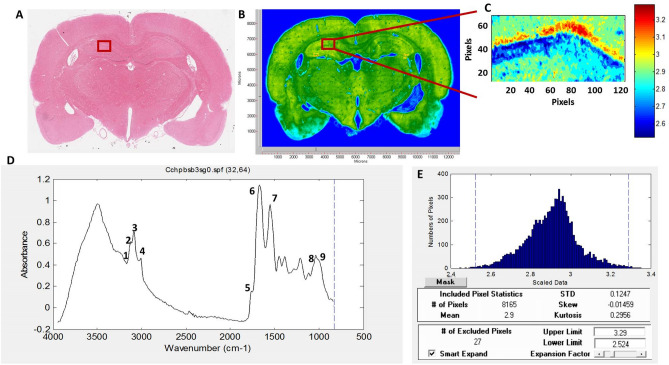
Figure 1.
(A) Histological image of an H&E stained brain section. (B) Representative FTIRI of the rat brain tissue shown in (A) with a rectangular label in hippocampal area indicating anatomic site examined by FTIRI. (C) Typical FTIR image from the rectangular labeled area before spectral processing. (D) The average spectra of hippocampal tissue of the control group in 4000–800 cm−1 region (The spectra were normalized with respect to the Amide A band). (E) The pixel histogram for the image shown in (C).

