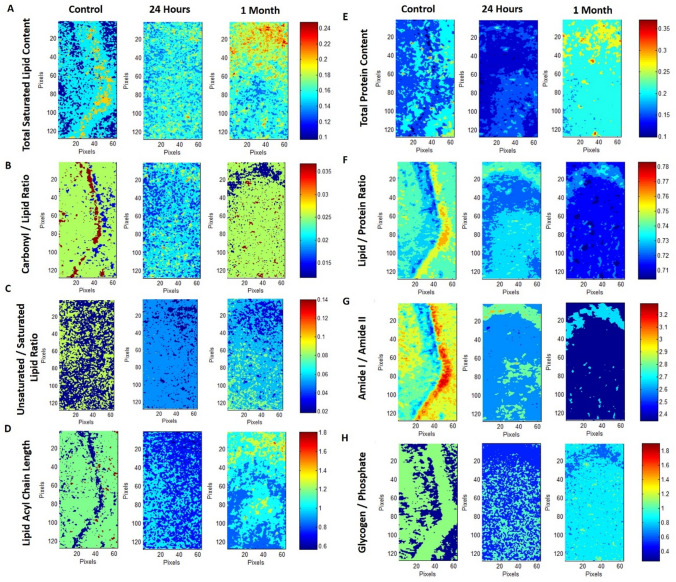
Figure 2.
Typical FTIR images of total saturated lipid content (A), carbonyl/lipid (B), unsaturated/saturated lipid (C), lipid acyl chain length (D), total protein content (E), lipid/protein (F), amide I/amide II (G) and glycogen/phosphate (H) band area ratios in left hippocampal tissue of control, 24 h and 1-month TBI groups. Color bars represent the scales for each of the parameters. Axes are in pixels, where one pixel is 6.5 μm. The pixel histograms for these images are shown in Fig. 3.

