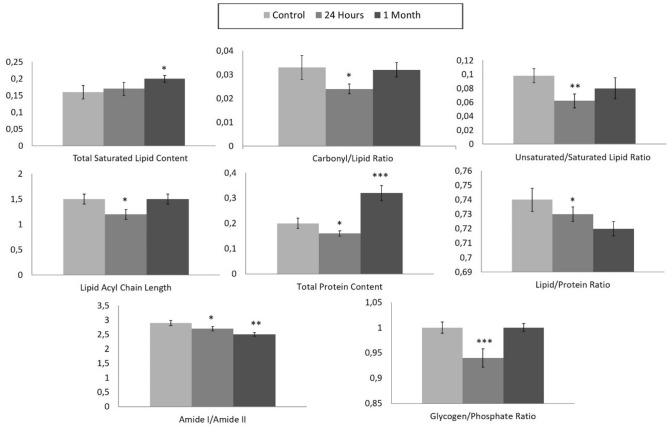
Figure 4.
Histograms of the calculated parameter values (total saturated lipid content, carbonyl/lipid, unsaturated/saturated lipid, lipid acyl chain length, total protein content, lipid/protein, amide I/amide II and glycogen/phosphate band area ratios) for 24 h and 1-month TBI groups. Statistical significance was determined by one-way ANOVA with Tukey’s post hoc test and the 95% confidence interval. Bars represent mean ± SD. *p ≤ 0.05; **p ≤ 0.01, ***p ≤ 0.001.

