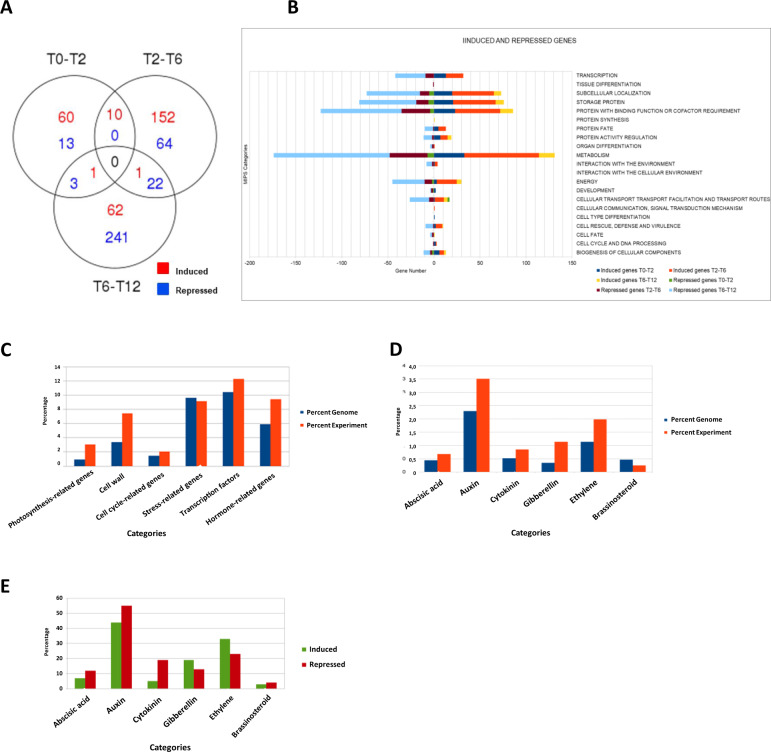
Fig. 2. Differentially expressed transcripts during early berry development and overrepresented categories revealed by exploratory transcriptome analysis.
A Representation of the number of differentially expressed genes at T0–T2, T2–T6, T6–T12 using Venn diagram. B Differentially expressed genes at T0–T2, T2–T6, and T6–T12, classified according to MIPS categories. C Overrepresentation of selected categories during early stages of berry development found in the genome (blue bars) and in the current experiment (orange bars). D Overrepresentation of hormone-specific categories during early berry development in grapevine. RNA-seq analysis was performed on a library generated from one biological replicate formed by a pool of ten carpels/fruits. E Overrepresentation of hormone-related categories in early stages of berry development in the genome (blue) and the current experiment (orange)

