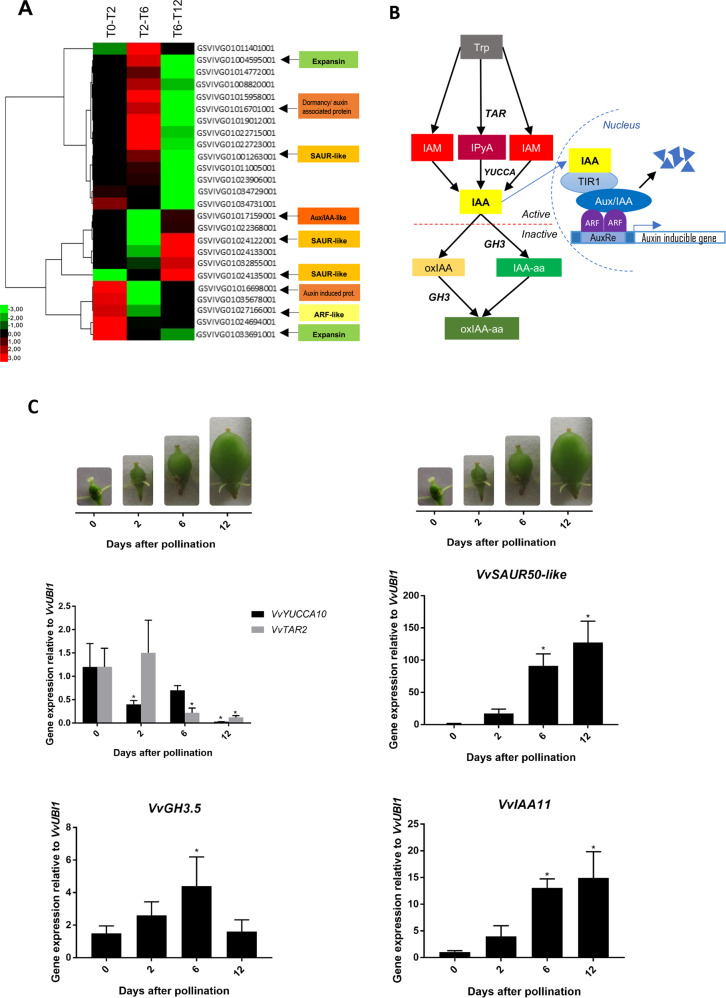
Fig. 3. Variations in the expression of auxin-related genes during early steps of berry development.
A Hierarchical cluster of auxin-related genes during early berry development at T0–T2, T2–T6, and T6–T12 obtained using Cluster 3.0 (Pearson correlation) and TreeView 1.1.6r2. B Diagram of the main components of auxin homeostasis and signaling pathways. Colored boxes represent IAA-related compounds, in italic letter the genes associated to the processes indicated by arrows. C qPCR analysis of auxin homeostasis-related genes normalized to VvUBI1. qPCR analysis of auxin signaling-related genes normalized to VvUBI1. In C, Student’s t test was performed and asterisks indicate statistically significant differences between time points, comparing one time point with the previous one or 0 DAP (p < 0.05). Bars represent standard error from three biological replicates. Representative pictures of the fruits at the different time points are included

