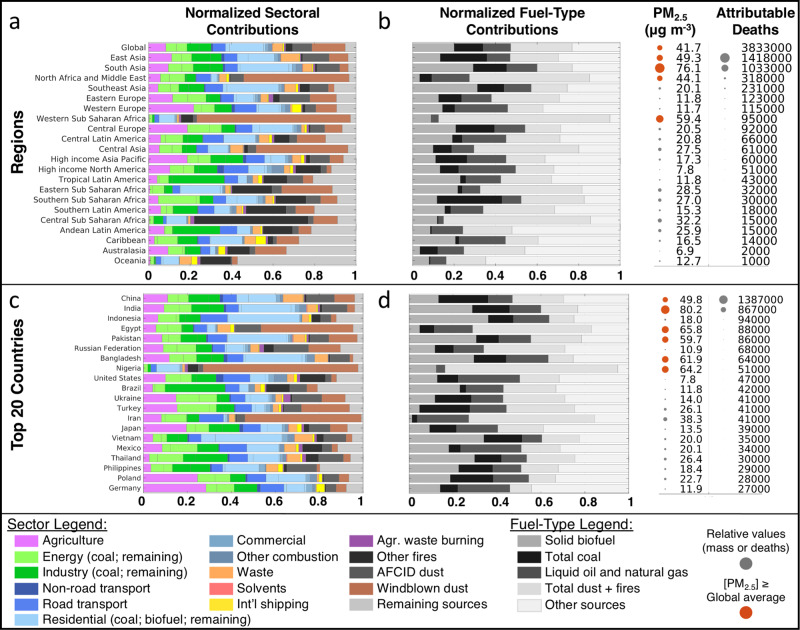
Fig. 3. Relative (fractional) source and fuel contributions to annual population-weighted mean PM2.5 mass and attributable deaths in 2017.
a, c Normalized sectoral source contributions for 21 world regions and the global average (a) and top 20 countries (c). Sorted by decreasing number of ambient PM2.5-attributable deaths (rounded to the nearest 1000). b, d Normalized contributions from the combustion of three fuel categories and remaining PM2.5 sources. To the right of b and d, annual population-weighted mean PM2.5 concentrations and associated attributable deaths are provided for each region/country. Relative amounts are illustrated by relative dot sizes. Concentrations above or equal to the global average are colored red.

