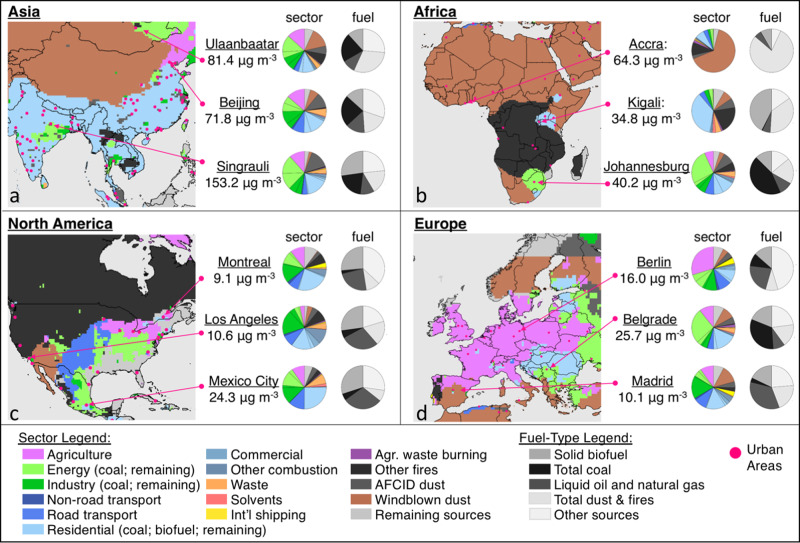
Fig. 5. Sub-national sources of PM2.5 mass and attributable mortality.
Results are shown for (a) Asia, (b) Africa, (c) North America, and (d) Europe. Maps illustrate the single source with the largest contribution in each model grid cell (0.5° × 0.625°). Population-weighted mean PM2.5 concentrations (calculated from 0.01° × 0.01° PM2.5 exposure estimates) and regional fractional source contributions are also shown for a select sub-set of sub-national regions, identified by the name of the nearest major city.

