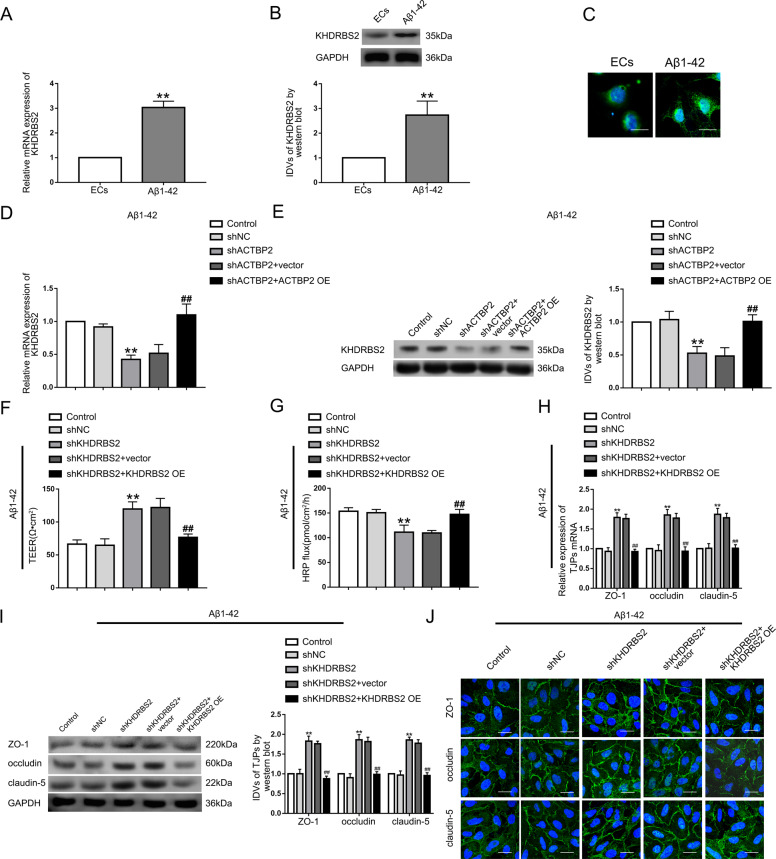
Fig. 2. KHDRBS2 endogenous expression and its effects on BBB permeability in Aβ1–42 microenvironment.
A Relative expression of KHDRBS2 mRNA in Aβ1–42-incubated ECs by qRT-PCR. B Relative expression level of KHDRBS2 protein in Aβ1–42-incubated ECs by western blot. Data represent mean ± SD (n = 3, each). **P < 0.01 versus ECs group. C Immunofluorescence staining analysis of the location of KHDRBS2 (green) in both the nucleus and the cytoplasm of Aβ1–42-incubated ECs. Scale bar represents 30 μm. D Effects of ACTBP2 on KHDRBS2 mRNA level by qRT-PCR. E Effects of ACTBP2 on KHDRBS2 protein level by western blot. Data are presented as mean ± SD (n = 3, each). **P < 0.01 versus shNC group. ##P < 0.01 versus shACTBP2 + vector group. F, G Effects of KHDRBS2 on TEER values F and HRP flux G in Aβ1–42 microenvironment. H Effects of KHDRBS2 on ZO-1, occludin, and claudin-5 expression levels in Aβ1–42-incubated ECs determined by qRT-PCR. I Effects of KHDRBS2 on ZO-1, occludin, and claudin-5 expression levels in ECs pre-incubated with Aβ1–42 determined by western blot. Data are presented as mean ± SD (n = 3, each). **P < 0.01 versus shNC group. ##P < 0.01 versus shKHDRBS2+vector group. J Effects of KHDRBS2 on ZO-1, occludin, and claudin-5 expression levels and distribution in Aβ1–42 microenvironment by immunofluorescence staining.

