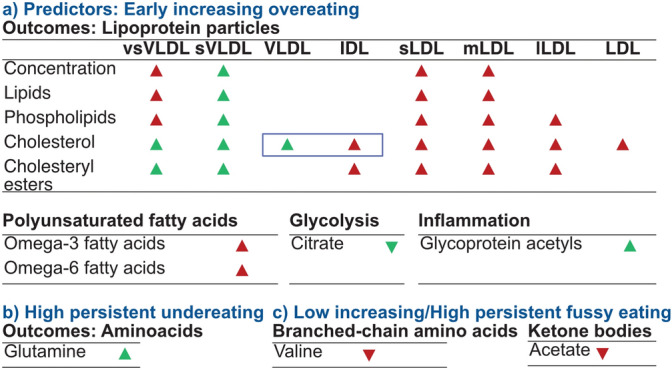
Figure 5.

Overview of significant associations between eating trajectories and metabolic markers and their mediation through body mass index (BMI) at age 12 years in the Avon Longitudinal Study of Parents and Children (ALSPAC, n = 3104). Arrows in upward direction indicate that the metabolic marker is measured to be higher in children with either high and persistent overeating, undereating, or fussy eating compared with children that are not reported by their parents to engage in any of these eating behaviours. A red arrow indicates that the eating behaviour is associated with the higher metabolite independent from the adolescents’ body mass index (BMI) at age 12 years compared to the reference category. Green arrows indicate that the association is mediated through BMI at age 12 years. The blue square indicates remnant cholesterol.
