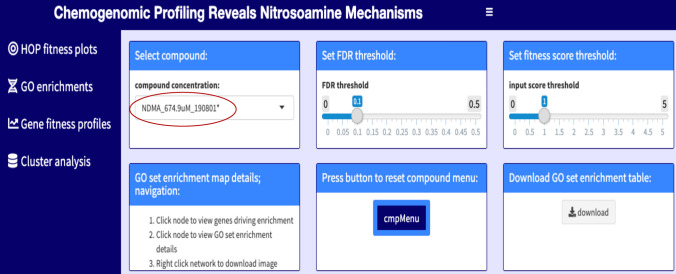
Figure 1.
Layout of the interactive chemogenomic web application. Selecting a compound of interest from the drop-down list (red circle), will allow one to explore (left panel) its fitness profile, GO enrichment profile, individual gene fitness profile (cofitness) or cluster analysis of all the compounds in our screens. Compounds were saved with their final concentration and the date (yy/mm/dd) when the count matrices were performed e.g. NDMA_674.9µM_190801. To allow for custom visualizations, the user can adjust thresholds for FDR and fitness scores. Image is a screenshot from the web application.

