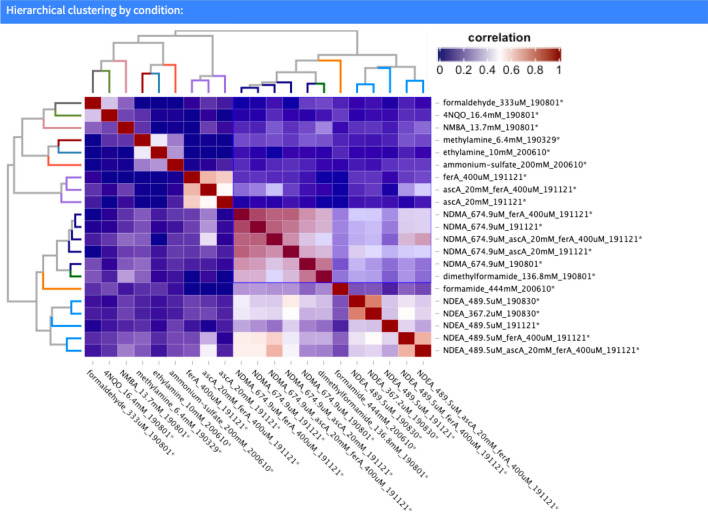
Figure 11.
Hierarchical cluster analysis of the all 22 chemogenomic screens. Pearson correlation was used to generate the “coinhibitory” square matrix and Ward was used as the distance. Branch colors on the two identical dendrogram indicate the three major clusters. Compounds within each cluster are highly correlated as indicated by the color scale as well as the dendrogram height and may correspond to compounds that have similar chemogenomic profiles and therefore may suggest similar mechanism of action. For example, the fitness profiles for NDEA all cluster tighter as expected (orange dendrogram branch color). Globally, two of the three major clusters (orange and navy branches in dendrogram) that include NDMA, NDEA, DMF and formamide exhibit significant correlation (visualized as darker red region in the heatmap). This finding is consistent with the chemogenomic profile similarity between these compounds, all of which were enriched for the genes involved in the arginine biosynthetic pathway. Figure was generated using the Bioconductor v3.12, https://www.bioconductor.org/.

