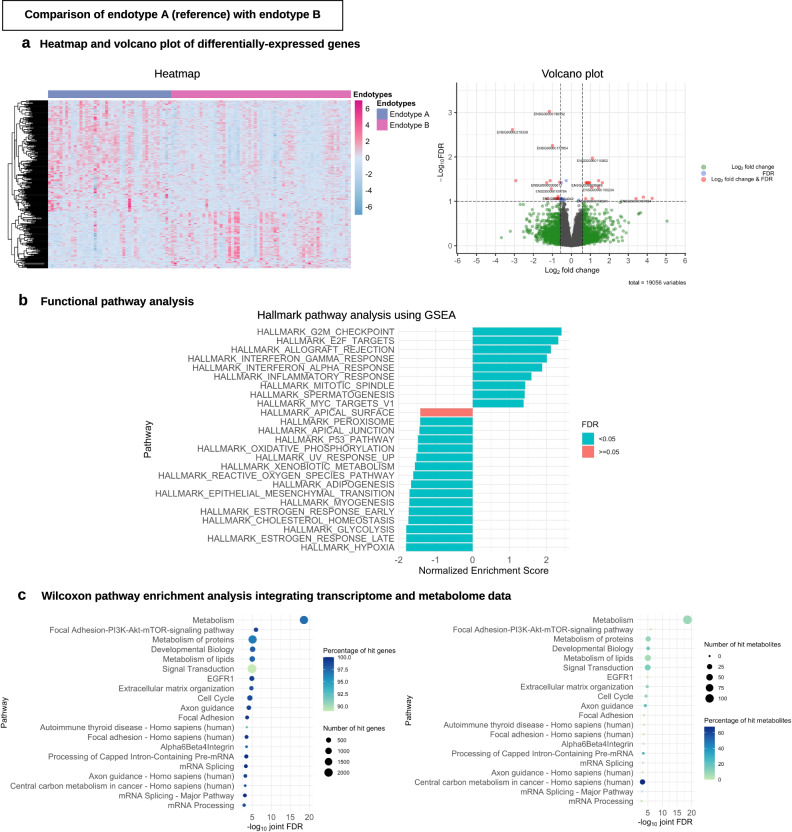
Fig. 5. Differential gene expression analysis and functional pathway analysis in the endotypes A vs. B comparison.
a Heatmap and volcano plot of differentially expressed genes. For the heatmap (left), we selected 300 genes with the most significant P value (two-sided raw P value) and the color bar indicates the scaled value of variance stabilizing transformation. For the volcano plot (right), the threshold of log2 fold change is |0.58| (i.e., ≥|1.5|-fold change) and that of FDR < 0.1. There were 29 differentially expressed genes that met these criteria. Of these, 11 Ensemble gene ids are annotated in the volcano plot due to space availability. These genes are presented in Supplementary Table 4. b Functional pathway analysis. For the functional class scoring analysis (left), we selected 25 pathways with the highest absolute value of normalized enriched score to visualize the plot. c Wilcoxon pathway enrichment analysis integrating transcriptome and metabolome data. For the Wilcoxon pathway enrichment analysis, we selected 20 pathways with the most significant joint FDR, and showed the numbers and proportions of hit genes (left) and metabolites (right) for the corresponding pathways. GSEA gene set enrichment analysis, FDR false discovery rate.

