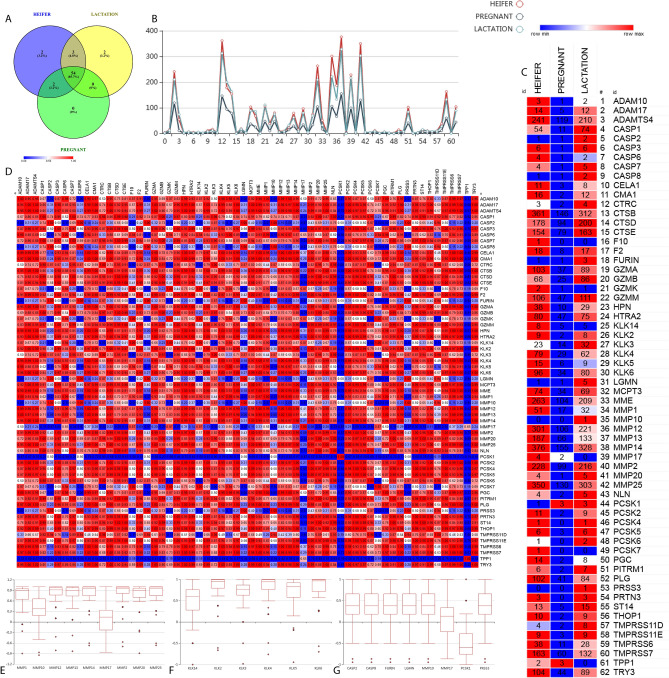
Figure 4.
Degradome Analysis: (A) Venn Diagram describing the common and unique protease enzyme identified among the stages in the protein data mapping. (B) Profile plot depicting the quantitative values of target proteins (Y-axis) map to 62 different protease enzymes (X-axis). (C) Quantitative heat map presenting the protease enzyme class with the respective target number in three conditions. (D) Pearson correlation-based similarity matrix plot of all protease enzymes and quantitative target relationship. (E) Distribution of isoforms of MMP enzymes identified in protein mapping and respective target determined in peptidome. (F) Distribution of isoforms of KLK enzymes isoforms identified in protein mapping and respective target determined in peptidome. (G) Protease wise comparison for Pearson correlation of 8 different enzyme (CASP2, CASP8, FURIN, LGMN, MMP10, MMP17, PCSK1, and PRSS3) in disagreement with physiological state and uncorrelated with one another.

