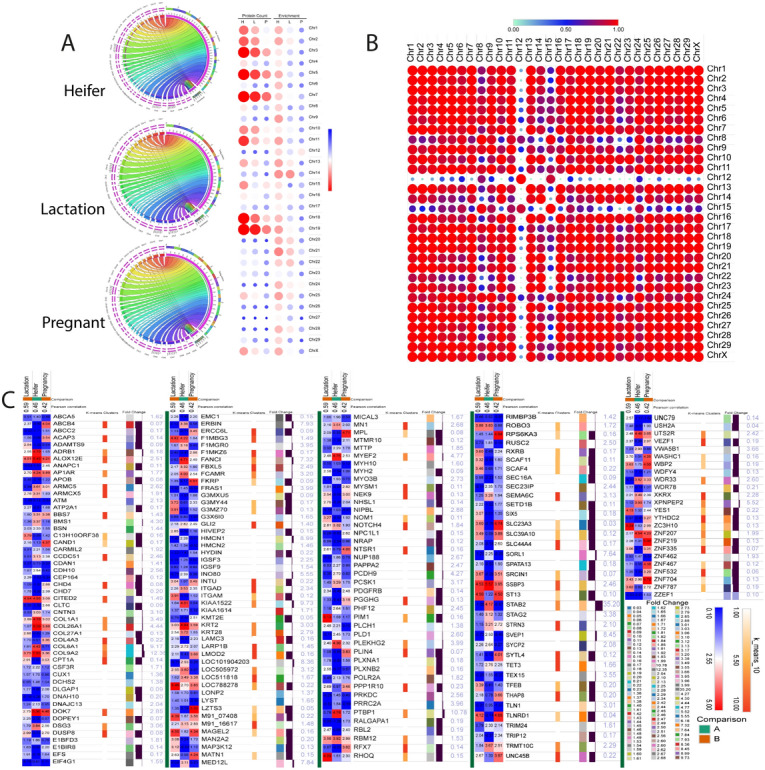
Figure 5.

Peptide to protein mapping: (A) Circos plots describing the mapping of peptides to specific chromosomes through parent protein. The right-hand side details the information of protein count heat map and enrichment of in three stages. (B) Pearson correlation-based similarity matrix plot of all chromosomes and associated target proteins determined with respect to endogenous peptides. (C) Heat map presentation of proteins quantitative data for common parental proteins among three stages. Fold change is calculated using the heifer as the control for lactation and pregnancy. Proteins were grouped based on the k-mean clustering and fold change calculate with respective color coding.
