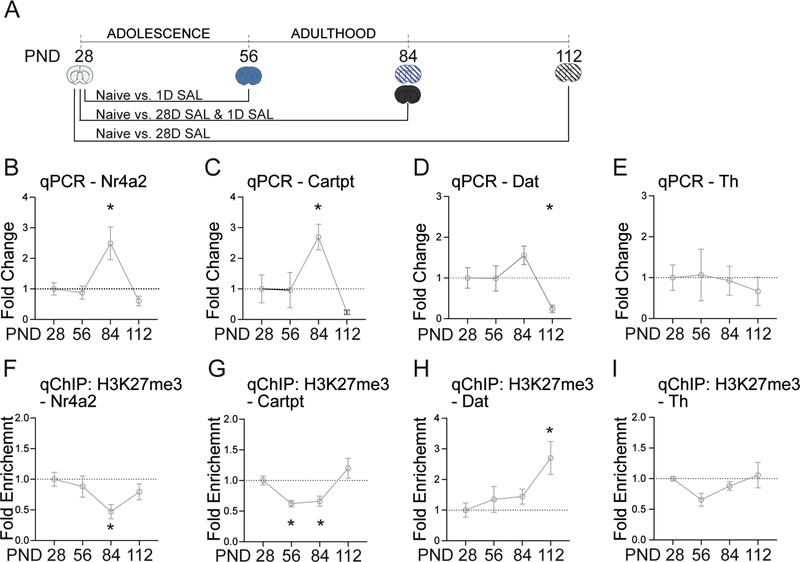
Figure 2. Epigenetic modifications at dopamine related genes across developmental time points in the VTA.
A.) Timeline of developmental time points. B.) Nr4a2 is activated at PND 84, (Students two-tailed ttest; PND 84, p=0.029, adjusted p = 0.012). C.) Cartpt is activated at PND 84 (Students two-tailed ttest; PND 84, p=0.013, adjusted p = 0.019). D.) Dat is repressed at PND 112 (Students two-tailed ttest; PND 112, p=0.015, adjusted p = 0.047). E.) No significant changes in Th. F.) H3K27me3 is depleted at the Nr4a2 promotor at PND 84 (Students two-tailed ttest; PND 84, p=0.012, adjusted p = 0.017). G.) H3K27me3 is depleted at the Cartpt promotor at PND 56 and 84 (Students two-tailed ttest; PND 56, p=0.001, adjusted p = 0.005; PND 84, p=0.002, adjusted p = 0.005). H.) H3K27me3 is enriched at the Dat promotor at PND 112 (Students two-tailed ttest; PND 112, p=0.006, adjusted p = 0.040). I.) H3K27me3 is depleted at the Th promotor at PND 56 (Students two-tailed ttest; p=0.029, adjusted p = 0.012). All data normalized to GAPDH relative to PND28. n = 5 – 12 mice per group. Error bars represent S.E.M. *p<.05 relative to PND28.

