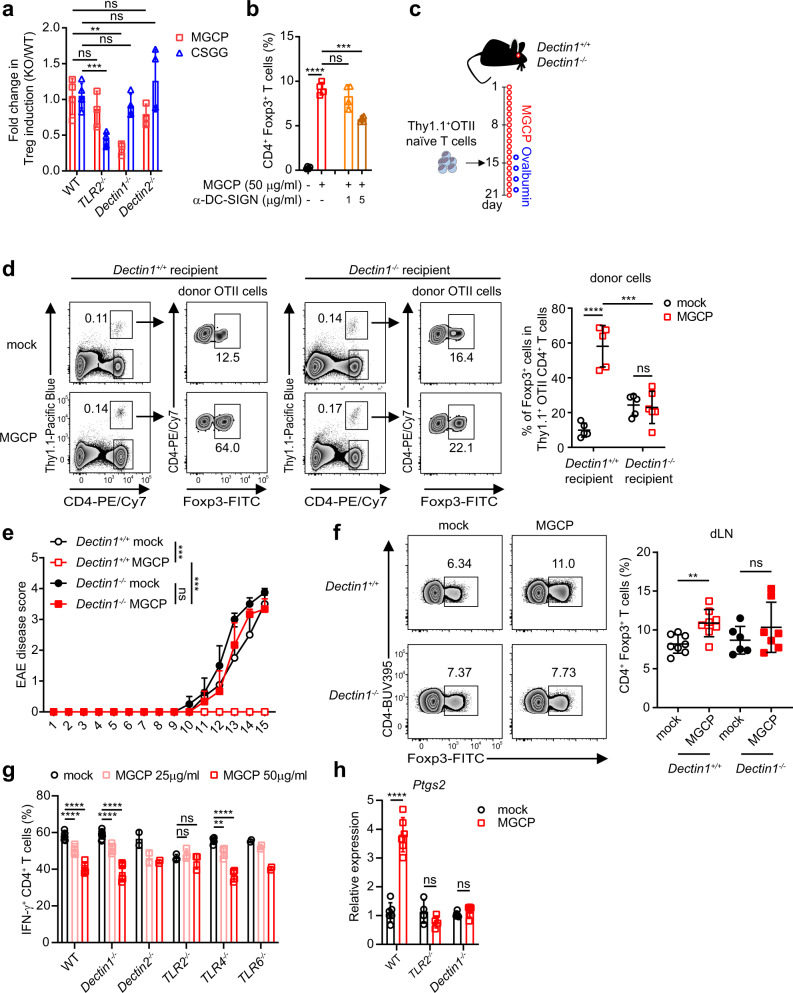
Fig. 7. MGCP associated PRR requirements in DCs.
a Splenic DCs isolated from indicated mice were treated with MGCP or CSGG followed by culture with naive CD4+ T cells under suboptimal Treg-inducing conditions. Relative capacities of Treg cell induction are shown. Data normalized with Treg cell induction by WT DCs. Data are analyzed from 2 (WT MGCP, TLR2−/− MGCP, Dectin1−/− MGCP, Dectin2−/− MGCP, TLR2−/− CSGG, Dectin1−/− CSGG, Dectin2−/− CSGG) or 3 (WT CSGG) independent experiments with minimum 3 samples. b Splenic DCs treated with DC-SIGN antagonistic antibody prior to MGCP stimulation were cultured with naive CD4+ T cells under suboptimal Treg skewing environment. CD4+Foxp3+ Treg percentage was analyzed. Data are analyzed from pooled data of 2 independent experiments with 4 samples. c Experimental scheme. Dectin1 sufficient and deficient mice were supplemented with mock or MGCP every day for two weeks prior to adoptive transfer of naive CD4+ T cells from Thy1.1+Foxp3GFP OTII mice. Recipient mice were continuously administered MGCP daily for an additional week and ovalbumin was fed every alternate days starting one day prior to adoptive transfer of the cells. d Representative flow cytometer plots and frequency of ovalbumin reactive Treg cells derived from donor cells was assessed in small intestine of recipient mice. Data are analyzed from 2 independent experiments with minimum 5 mice. e, f EAE was induced in WT and Dectin1−/− mice upon immunization with MOG35–55 and complete Freund’s adjuvant (CFA). Immunized mice were injected daily with MGCP, or distilled water as mock, from the day of immunization. e Graphical representation of EAE clinical scores for each treatment groups. Data are representative of 2 independent experiments and analyzed from minimum 3 mice. f Representative flow cytometric plots (left) and frequency (right) of CD4+Foxp3+ T cells in draining lymph nodes of indicated groups. Data are analyzed from pooled data of 2 independent experiments with minimum 6 mice. g DCs were isolated from indicated PRR knock-out mice and stimulated with MGCP followed by culture with naive CD4+ T cells under suboptimal Th1 skewing conditions. Frequencies of Th1 cells generated are shown. Data are analyzed from 2 independent experiments with minimum 3 samples (WT, Dectin1−/−, TLR2−/−, TLR4−/−) or 2 samples for Dectin2−/−, TLR6−/− cells. h DCs were isolated from WT, TLR2−/−, and Dectin1−/− mice and stimulated with MGCP for 8 h. Total mRNA was isolated and expression of Ptgs2, a gene that encodes Cox2, was assessed by qRT-PCR analysis. Data are analyzed from 2 independent experiments with minimum 4 samples. Each dot represents an individual mouse or sample. The graphs show the mean ± SEM. e ***p < 0.001 and ±SD. a, b, d, f–h **p < 0.01, ***p < 0.001, ****p < 0.0001 (two-tailed student’s t test). ns: not significant. Source data are provided as a Source data file.

