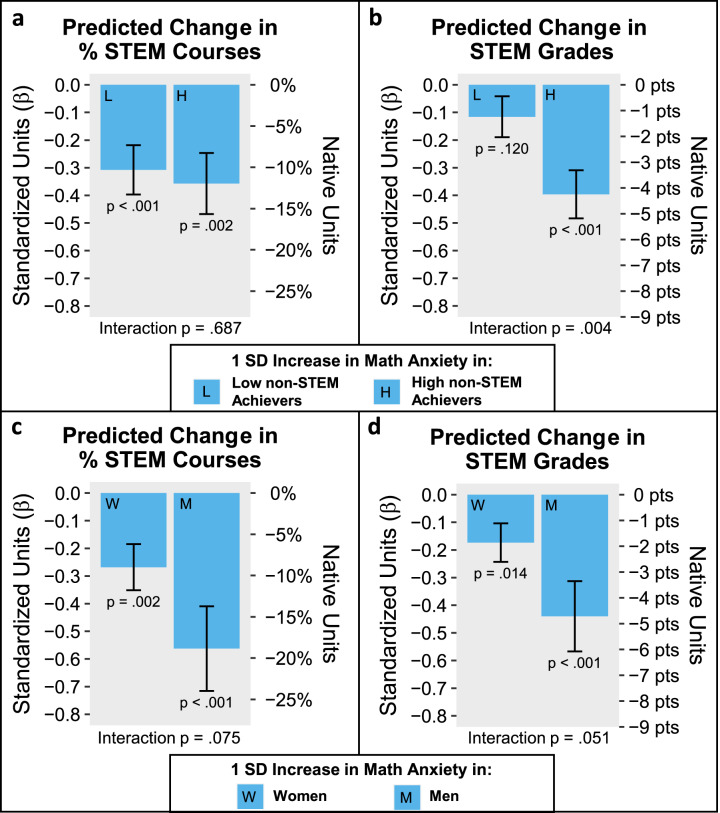
Fig. 3. Testing moderators of the predictive effect of Math Anxiety on university STEM outcomes.
Figure 3 shows the predicted change in STEM outcomes associated with a 1 SD (standard deviation) increase in Math Anxiety among different groups of students. The estimates are derived from multiple regression models that include all predictors (including Math Ability) used in Fig. 1, as well as the relevant interaction term. The p-value associated with the relevant interaction term (Fig. a–b: Math Anxiety × non-STEM Grades; Fig. 3c–d: Math Anxiety × Gender) is shown at the bottom of each figure. This interaction term in effect formally tests for a difference between the two bars in that subfigure. Figure a and b show the predicted change in STEM outcomes associated with a 1 SD increase in Math Anxiety in students with 1 SD below or above the mean in non-STEM academic achievement (high vs. low non-STEM Grades). Figure c shows the predicted change in STEM outcomes associated with a 1 SD increase in Math Anxiety in female and male students. In each figure, the left y-axis shows the DV in standardized units, which corresponds to standardized β coefficients. The right y-axis shows the DV in the native units of each measure. Error bars reflect standard errors.

