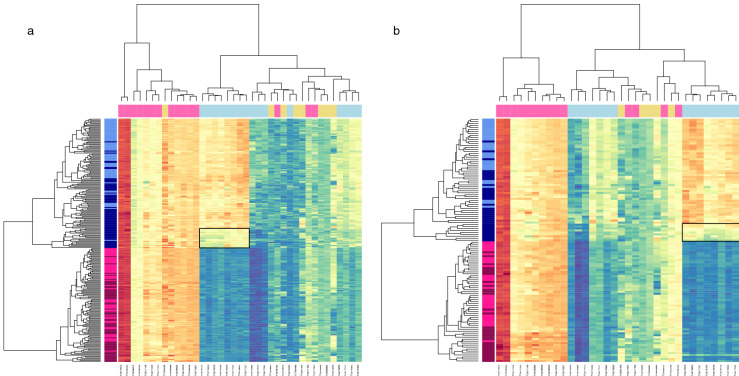
Figure 1.
Hierarchical clustering of transcripts assigned to a normal-specific sex associated co-expression network. Figure displays heat maps with hierarchical clustering of samples (on the Y axis) and transcripts (on the X axis) in discovery (a) and replication (b) datasets, limited to transcripts clusters (TC) assigned to the normal-specific, sex associated, gene co-expression network. Expression is shown on a continuous colour scale from blue (low) to red (high). Sample colour (y axis) reflects tissue type (light—histologically normal, dark—tumour) and sex (blue—male, pink—female). Transcript colour (x axis) reflects chromosome class (yellow—autosomal, pink—X, blue—Y). Low Y sample/TCs are highlighted by a solid black box. The data presented in this Figure show broad preservation of a co-expression structure amongst these transcripts in the discovery and replication datasets and confirm the presence of a low Y chromosome expression cluster in a subset of male tumours.

