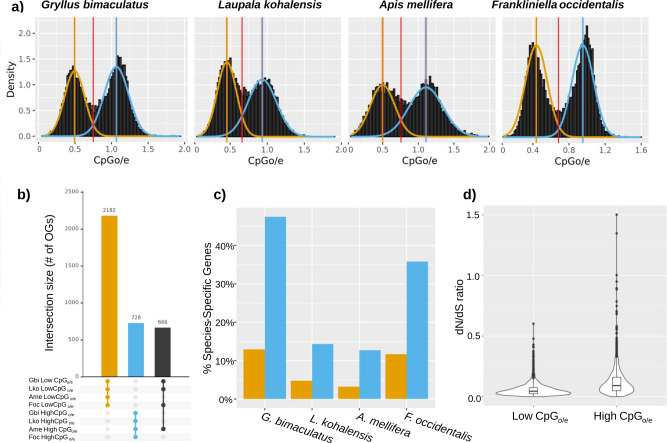
Fig. 2. CpGo/e bimodal distribution across distant insects.
a The distribution of CpGo/e values within the CDS regions displays a bimodal distribution in the two cricket species studied here, as well as in the honeybee A. mellifera and the thrips F. occidentalis. We modeled each peak with a normal distribution and defined their intersection (red line) as a threshold to separate genes into low- and high- CpGo/e value categories, represented in yellow and blue respectively. b UpSet plot showing the top three intersections (linked dots) in terms of the number of orthogroups (OGs) commonly present in the same category (low- and high- CpG o/e) across the four insect species. The largest intersection corresponds to 2182 OGs whose genes have low CpGo/e in the four insect species, followed by the 728 OGs whose genes have high CpGo/e levels in all four species, and 666 OGs whose genes have low CpGo/e in the three hemimetabolous species and high CpGo/e in the holometabolous honeybee. Extended plot with 50 intersections is shown in Supplementary Fig. 4. c Percentage of species-specific genes within low CpGo/e (yellow) and high CpGo/e.(blue) categories in each insect, indicating that more such genes tend to have high CpGo/e values. d One-to-one orthologous genes with low CpGo/e values in both crickets have significantly lower dN/dS values than genes with high CpGo/e values.

