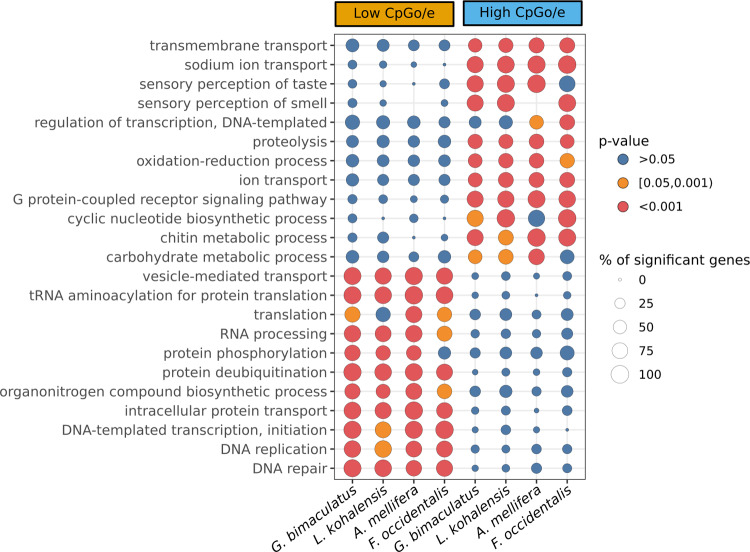
Fig. 3. Functional differences between high- and low- CpGo/e genes.
Enriched GO terms with a p value <0.00001 in at least one of the eight categories, which are high CpGo/e and low CpGo/e genes of G. bimaculatus, L. kohalensis, F. occidentalis, and A. mellifera, respectively. The dot diameter is proportional to the percentage of significant genes with that GO term within the gene set. The dot color represents the p value level: blue >0.05, orange [0.05, 0.001), red <0.001. Extended figure with all significant GO terms (p value <0.05) available as Supplementary Fig. 3.

