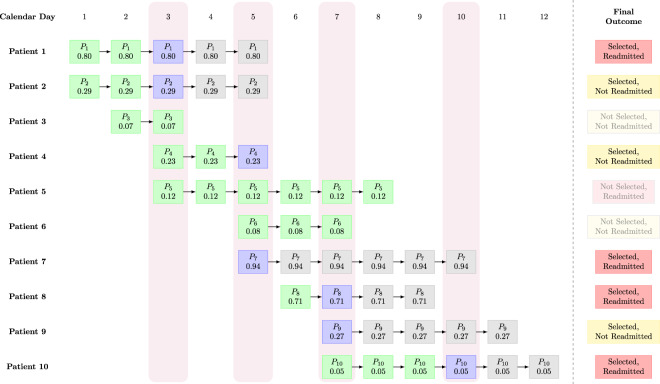
Fig. 2. Visualization of an example of the provider workflow in the simulation.
Each square cell is a postoperative patient in the hospital on a particular day. Within each cell, Pi indicates the ith patient, while the number underneath indicates the predicted readmission probability on that day (e.g., for patient 1 on day 1, this is 0.80). If there is no square cell, then the patient has either not yet completed surgery, or has been discharged. For example, patient 5 completes surgery on day 3 and is discharged on day 8; before day 3, the patient is either still in surgery or has not yet been admitted; after day 8, the patient is no longer present in the hospital. The vertical rectangles shaded in light purple indicate days on which the provider selects patients. In this example, we assume that the provider works on days 3, 5, 7, and 10, and has a capacity of two patients, i.e., the provider can select at most two patients to apply the intervention to on each of those four days. On a given day, if a patient is available for selection and has not yet been selected, they are shaded in green. On a given day, if the provider selects them, they are shaded in blue. After the provider selects them and applies the intervention pathway, the patient is shaded in gray for the remaining days of their hospital stay. As an example of the provider selection process, observe that on day 3, there are 5 postoperative patients available (patients 1, 2, 3, 4, and 5). The provider selects patients 1 and 2, because these two patients have the highest predicted probability of readmission (0.80 and 0.29, respectively). After patients 1 and 2 have been selected, they cannot be selected again; for the remaining days that those two patients are in the hospital, they are indicated with the gray square cells. Notice that patient 4, who was not selected on day 3, is later selected by the provider on day 5; in this case, patient 4 was not among the top two patients on day 3 but became one of the top two patients on day 5. On the other hand, patient 3 is discharged before day 5; thus, this patient is lost and never ends up receiving the intervention pathway. We also note that on day 10, the provider only selects one patient (patient 10), because the other two patients (patients 7 and 9) were already selected previously (days 5 and 7, respectively). The rectangular cells on the right summarize the final outcome with each patient, with regard to whether or not they were selected by the provider, and whether or not they eventually experienced an ED readmission. In this example, there are a total of 7 patients who are selected, so the patients seen (PS) metric is 7. The number of patients selected and who get readmitted is exactly 4, so the RA metric is 4. Assuming an effectiveness constant of 10%, the ERP metric is 4 × 10% = 0.40.

