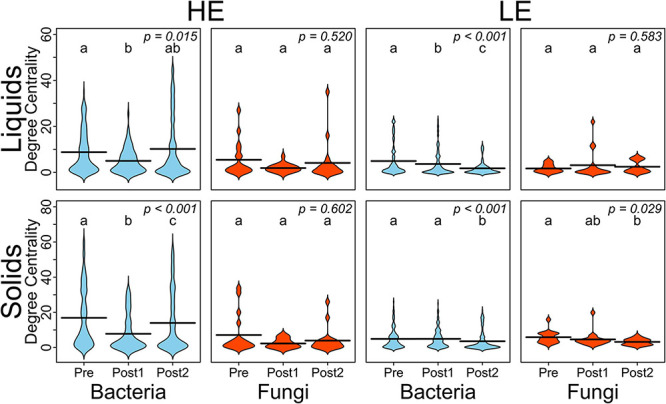
FIGURE 2.

Beanplots expressing average degree-centrality of nodes by domain and over time for HE and LE-derived rumen liquids and solids. Shared letters indicate no difference in degree between timepoints (P > 0.05).

Beanplots expressing average degree-centrality of nodes by domain and over time for HE and LE-derived rumen liquids and solids. Shared letters indicate no difference in degree between timepoints (P > 0.05).