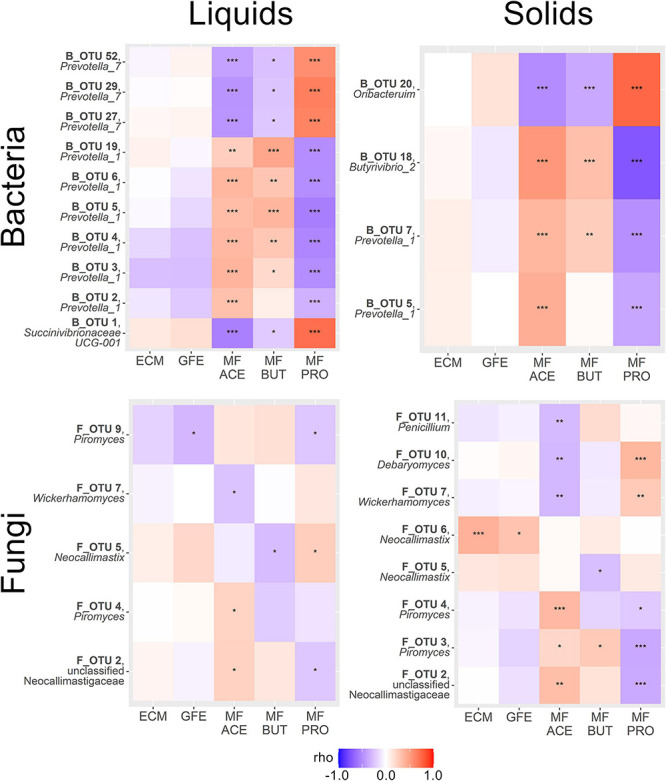
FIGURE 4.

Heatmaps summarizing correlations between SIMPER-implicated OTUs and phenotypic variables of interest within amplicon and sample type. Variables are energy corrected milk (ECM), gross feed efficiency (GFE), and molar fraction acetate (MF ACE), propionate (MF PRO) and butyrate (MF BUT). Genera displayed beneath OTU names. Color scale reflects strength and direction of correlation (Spearman’s ρ statistic), and asterisks within the heatmap indicate statistical significance (*P < 0.05, **P < 0.01, ***P < 0.001).
