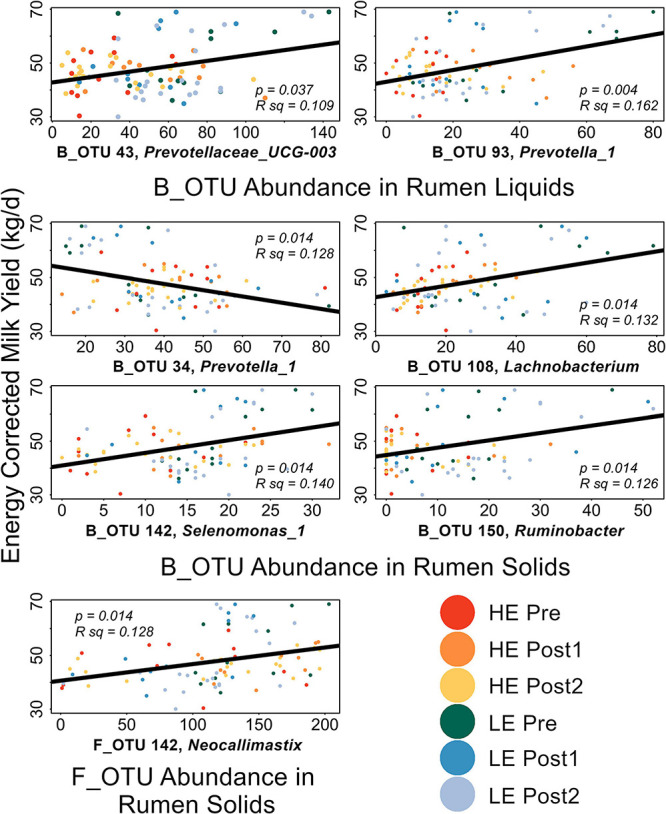
FIGURE 5.

Scatterplots of LEfSe-implicated OTUs with significant correlations to production metrics. FDR-corrected p-values and the R2 values for the linear mode (black) are expressed on each plot. Points are color coded by initial efficiency of host and time within trial. Genus-level classification of the OTUs are as follows: B_OTU 43: Prevotellaceae_UCG-003; B_OTU 93: Prevotella_1; B_OTU 34: Prevotella_1; B_OTU 108: Lachnobacterium; B_OTU 150: Ruminobacter; B_OTU 142: Selenomonas_1; F_OTU 6: Neocallimastix.
