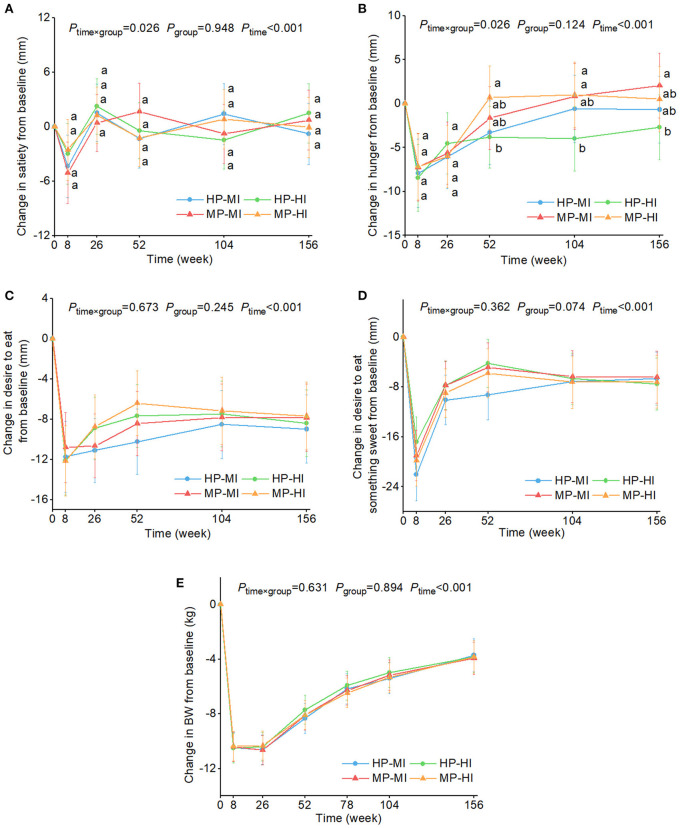
Figure 4.
Estimated marginal means and 95% CI in changes in ratings of satiety (A), hunger (B), desire to eat (C), and desire to eat something sweet (D), and body weight (E) over time by four intervention groups. Analyses were performed using a linear mixed model with repeated measures adjusted for age, sex, ethnicity, baseline appetite ratings (0 weeks), and time as fixed effects and participant-ID and intervention center as random effects. Time×group or group×sex or group×age interaction terms were added. If the interaction was significant, post hoc multiple comparisons with Bonferroni correction were conducted at each time point. Values with the different lowercase letters were significantly different, P < 0.05. No group × sex or group × age interaction was observed. BW, body weight; HP-MI, high protein-low glycemic index diet, moderate intensity physical activity; HP-HI, high protein-low glycemic index diet, high intensity physical activity; MP-MI, moderate protein-moderate glycemic index diet, moderate intensity physical activity; MP-HI, moderate protein-moderate glycemic index diet, high intensity physical activity.

