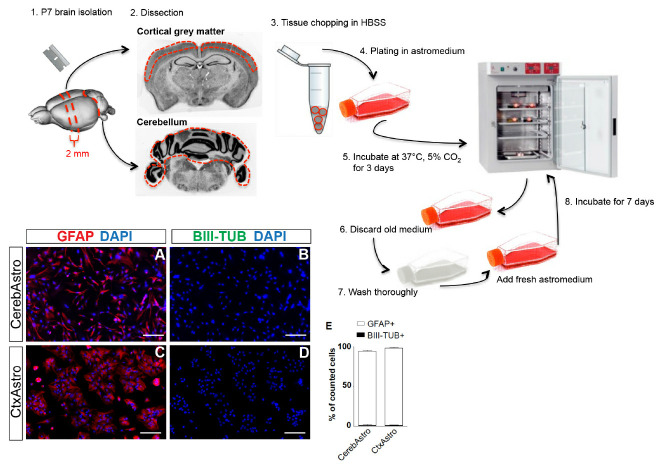
Figure 1. Postnatal astrocyte culture.
Upper scheme illustrates the main steps for cortical and cerebellar astrocyte culture. Red dashed lines represent approximate regions of cuts. Lower left panels (A-D) show both cultures at 80% confluence and immunostained for the astrocytic marker GFAP (red) and neuronal marker BIII-tubulin (green). Quantifications show that > 97% of the cells in both cultures are GFAP+/BIII-tubulin- (E). Cereb = cerebellum, Ctx = cortex, Astro = astrocytes. Nuclei are stained with DAPI (blue), scale bars = 25 µm.

