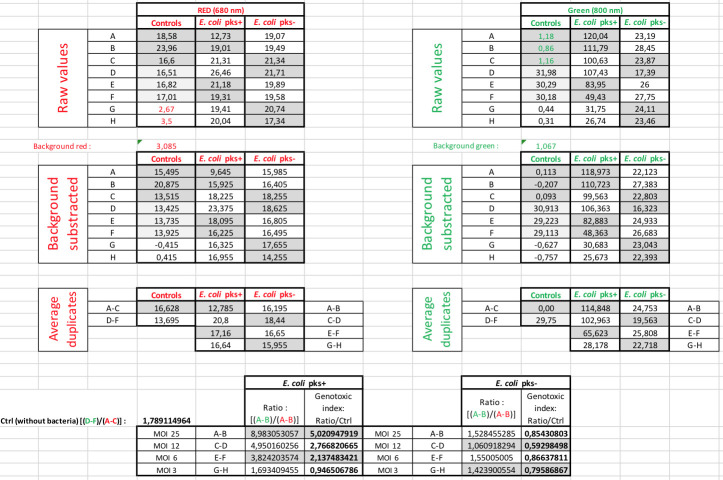
Figure 3. Quantification of phosphorylated H2AX (γ-H2AX) from infected HeLa cells with pks+ E. coli or with pks- E. coli at various MOI.
A. Example of an In-Cell Western plate image with merged detection of total DNA (red, 680 nm) and γ-H2AX (green, 800 nm). A high level of γ-H2AX can be observed at high MOI for the cells infected with E. coli pks+. B. The γ-H2AX fold induction (γ-H2AX fluorescence normalized to the amount of cells per well), calculated relative to the control (non-infected cells), reveals a genotoxic dose-response depending on the MOI in cells infected by colibactin-producing bacteria (E. coli pks+) compared to cells infected by non colibactin-producing bacteria (E. coli pks-). Data represented in the graph were obtained from two biological replicates and two independent experiments. Data were plotted using GraphPad Prism 6.0. The mean with standard deviation (sd) is shown.

