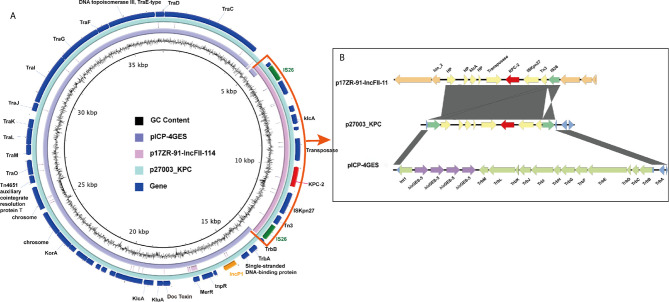
Figure 1.
Similarity of the genetic structure of p27003_KPC with that of two other plasmids. (A) Alignments of similar genes on plasmids are shown as concentric parts. The outer ring shows the ORFs on p27003_KPC. bla KPC-2 is colored red, while IncP1 and IS26 are colored orange and green, respectively. (B) The hybrid parts are highlighted and described in the box on the right. ORFs are illustrated as arrows. Shading areas indicate the high homology regions (≥95% identity) with the yellow or blue CDS. Orange and green boxes represent the backbone CDS on p17ZR-91-IncFII-11 and pICP-4GES, respectively.

