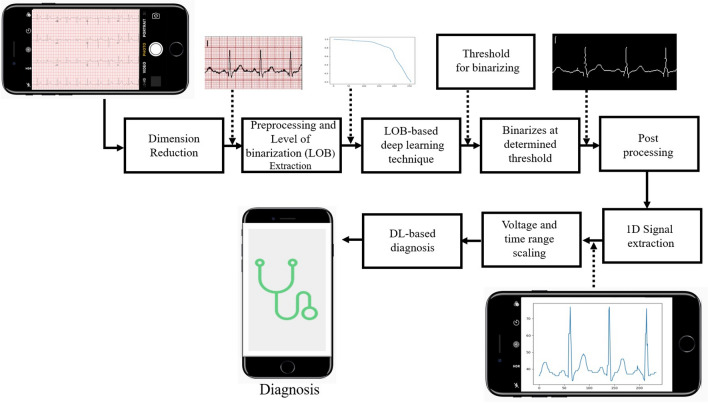
Fig. 1.
Flow diagram for automated binarization and diagnosis using deep learning from 12-lead paper ECG records. The 12 lead was converted to a single lead, pre-processed for shadow removal, and the Level of Binarization (LOB) characteristic curve is extracted. Then the DL model is used, and the background is removed. The signal is post-processed to remove the labels. The 1-D signal is then extracted using vertical scanning. A deep learning-based diagnosis was done at the end

