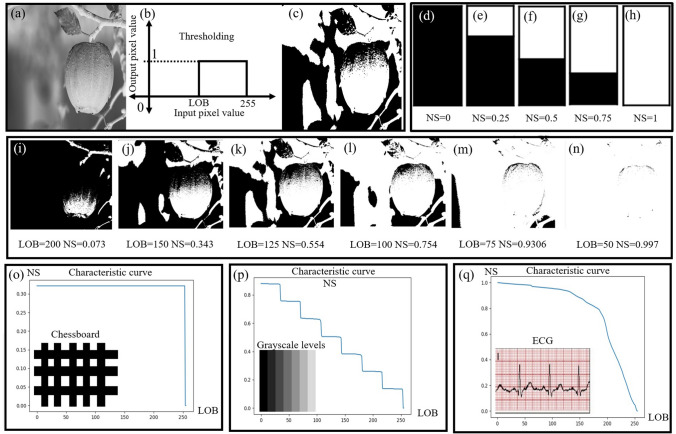
Fig. 2.
Concept of LOB characteristic curve a–c thresholding of sample grayscale image for a particular level of Binarization (LOB) from 0 to 255, d–h normalized sum (NS) varies from 0 to 1 for complete black to complete white image, i–n binarized images at different threshold values (LOB) and NS, o Chessboard image (as shown in the snippet) and its corresponding characteristics curve showing the step transition from black to white, p image with different Grayscale levels and its corresponding characteristics curve, q characteristics curve of single-lead ECG (shown in the snippet) showing two slopes, one for ECG signal and other for background grid

