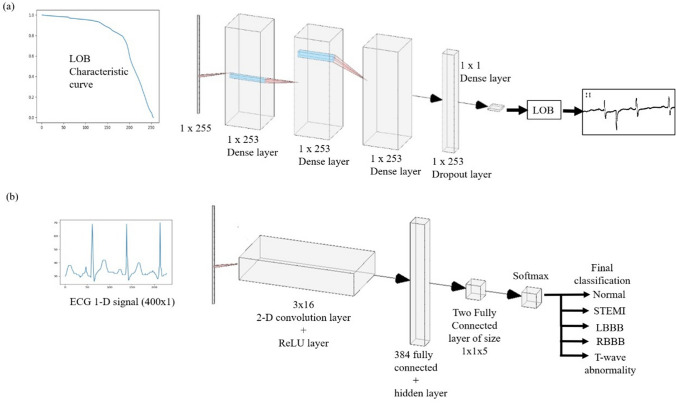
Fig. 3.
a Deep learning Model for determining threshold value. The input is LOB characteristic curve of size is . The 1-D signal is passed through multiple Dense layers. The output is then passed through a dropout layer. The data is then passed through the Dense model of dimension and we get the predicted output threshold value. b Deep learning Model for diagnosis. The input signal of the size is passed to the convolution layer along with the ReLU layer of dimension . After that, it is passed through a series of 384, and two fully connected layers along with hidden layers. Then it is passed through the Softmax layer which further diagnoses the ECG report

