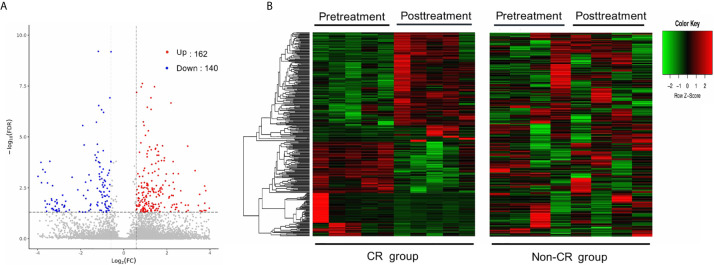
Figure 2.
Differentially expressed genes (DEGs) between pre-treatment and post-treatment conditions. (A) Volcano plot of DEGs between pre-and post-treatment conditions in the CR group. Significantly up-regulated genes are marked in light red and downregulated ones are marked in blue. (B) Hierarchical clustering heatmap. Heatmaps were generated using the expression levels of the 302 DEGs identified in the CR group. The abscissa indicates different samples, and the ordinate indicates different gene probes. These genes were only differentially expressed in the CR group (left), but not in the non-CR group (right).

