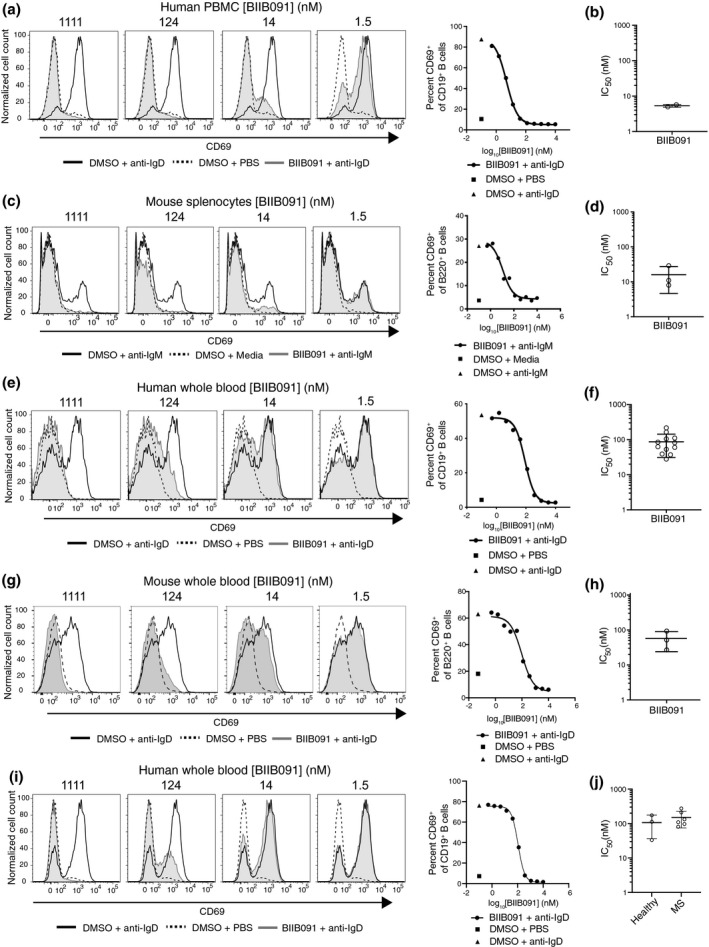
Figure 2.

BIIB091 inhibits human and mouse B‐cell activation in vitro. (a–d) Histogram overlays of CD69 expression on CD19+ B cells from human PBMC (a) or on B220+ mouse splenic B cells (c) treated with DMSO or titrating concentrations of BIIB091 and stimulated with polyclonal anti‐human IgD (a) or anti‐mouse‐IgM cross‐linked with a secondary antibody (c). Phosphate‐buffered saline (PBS) was used as control. IC50 values for two healthy donors (b) or from three independent mouse experiments (d) are shown along with mean and SD (5.4 ± 0.5 nm and 16 ± 11 nm, respectively). (e–h) Histogram overlays of CD69 expression on B cells from human (e) or mouse (g) whole blood treated with DMSO or titrating concentrations of BIIB091 and stimulated with PBS or anti‐human IgD (e) or anti‐mouse IgD (g). IC50 values for 12 healthy human donors (f) and from three mouse whole blood independent experiments (h) are shown along with mean and SD (87 ± 56 nm and 57 ± 33 nm, respectively). (i, j) Histogram overlays of CD69 expression on CD19+ B cells from whole blood of patients with MS or healthy volunteers treated with DMSO or titrating concentrations of BIIB091 and stimulated with anti‐human IgD (i). Individual IC50 values for three healthy donors and six patients with MS (individual data points) are shown along with mean and SD (106 ± 70 nm and 151 ± 76 nm, respectively) (j). IC50 differences between the two groups were not statistically significant (unpaired t‐test with Welch's correction).
