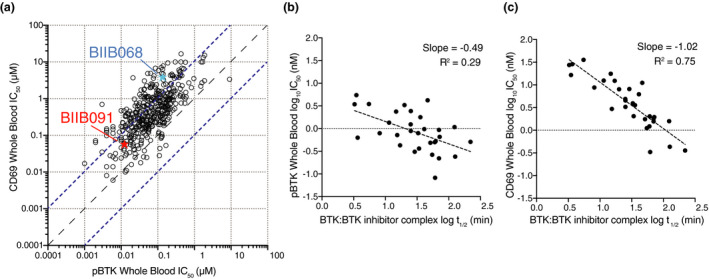
Figure 3.

The residency time of BTK inhibitors in the kinase pocket dictates potency against distal B‐cell pharmacodynamic responses. (a) Dot plot showing IC50 values for constitutive BTK phosphorylation in unstimulated cells (pBTK, x‐axis) and CD69 expression in anti‐IgD‐stimulated B cells (CD69, y‐axis) in whole blood (WB) assays. Data from n = 420 Biogen‐reversible BTK inhibitors are shown with BIIB091 and BIIB068 (early generation BTK inhibitor 11 ) highlighted in red and blue, respectively. Dashed lines indicate the equal potency line and the 10‐fold deviation from the equipotency line. (b, c) Dot plots showing plasma protein binding‐corrected IC50 values for constitutive BTK phosphorylation in unstimulated cells (b) and CD69 expression in anti‐IgD‐stimulated B cells (c) against the half‐life of the BTK:BTK inhibitor complex measured by surface plasmon resonance. Data from n = 30 Biogen‐reversible BTK inhibitors are shown.
