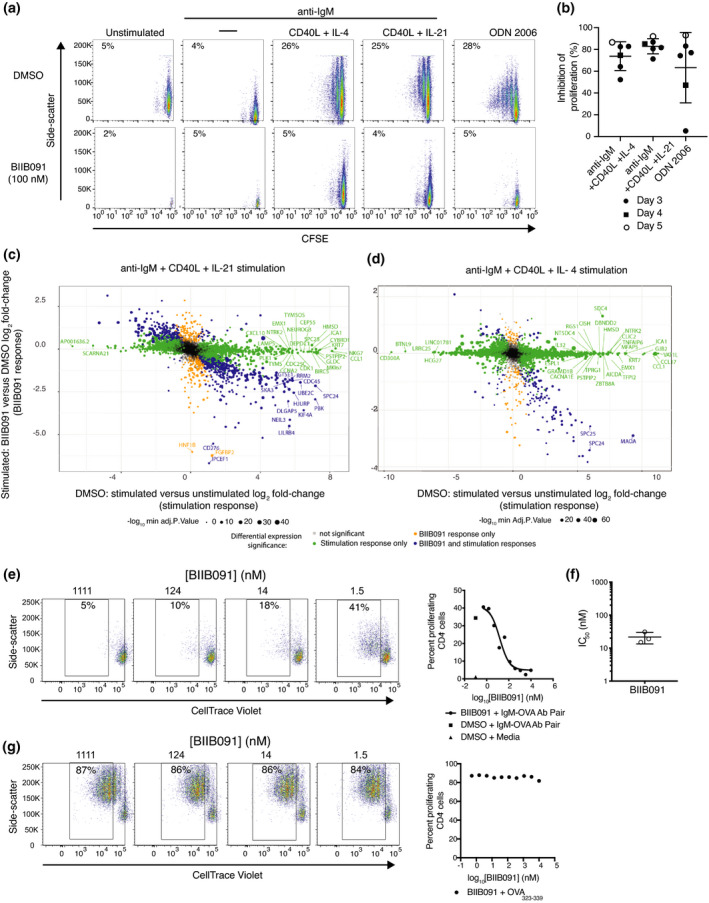
Figure 4.

BIIB091 blocks B‐cell proliferation and antigen‐presenting functions in vitro and the associated B‐cell activation transcriptional programme. (a, b) Pseudocolor plots displaying side scatter against the dilution of CFSE used as a measure of proliferation of human B cells left either unstimulated or stimulated for 5 days with anti‐IgM alone, anti‐IgM with CD40L and IL‐4, anti‐IgM with CD40L and IL‐21, or CpG ODN 2006 in the presence or absence of 100 nm BIIB091 (a). Percent inhibition of B‐cell proliferation (relative to proliferation level observed in DMSO control condition) obtained from six independent experiments (individual data points) and measured either three (filled circle), four (square) or five (open circle) days post‐stimulation (b). (c) Log2 fold‐change × fold‐change plot of differentially expressed genes (FDR < 0.05; fold change > |1.2|) observed when comparing anti‐IgM, CD40L and IL‐21‐stimulated human B cells to unstimulated B cells on the x‐axis and anti‐IgM, CD40L and IL‐21‐stimulated B cells treated with 100 nm BIIB091 to stimulated B cells treated with DMSO on the y‐axis. Data from five independent experiments. (d) Log2 fold‐change × fold‐change plot of differentially expressed genes (FDR < 0.05; fold change > |1.2|) observed when comparing anti‐IgM, CD40L and IL‐4‐stimulated human B cells to unstimulated B cells on the x‐axis and anti‐IgM, CD40L and IL‐4 stimulated B cells treated with 100 nm BIIB091 to stimulated B cells treated with DMSO on the y‐axis. Data from five independent experiments. (e–g) Pseudocolor plots displaying side scatter against the dilution of CellTrace Violet used as a measure of proliferation of mouse OTII CD4+ T cell (expressing transgenic T‐cell receptor specific for the ovalbumin (OVA) peptide 323–339) upon B‐cell receptor targeting of OVA protein antigen to B cells using antibodies directed against the B‐cell receptor (e) or upon addition of OVA peptide 323–339 (g) to co‐cultures of splenic B cells and OTII T cells in the presence or absence of titrating concentrations of BIIB091 (left). Dot plot shows the per cent of proliferating OVA323–339‐specific CD4+ T versus the concentration of BIIB091 (right). IC50 values obtained with B‐cell receptor targeting of OVA protein antigen to B cells in three independent experiments are shown along with the mean and SD (22 ± 8 nm) (f).
