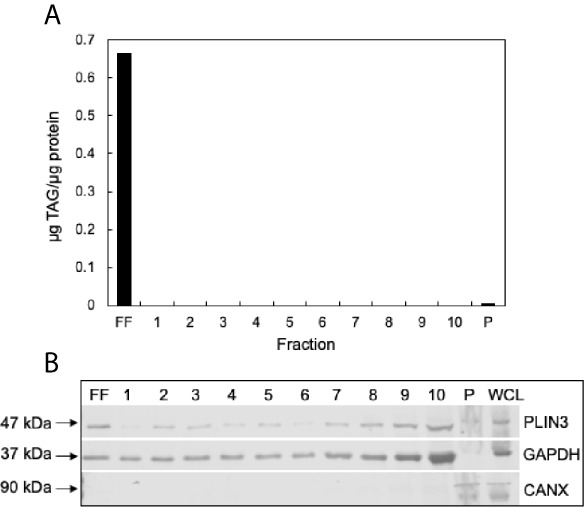
Figure 3.

Validation of cytoplasmic lipid droplet (CLD) isolation. (A) Triacylglycerol (TAG) to protein ratio of each isolated fraction. CLDs were isolated from MCF10CA1a cells using sucrose density gradient ultracentrifugation. Fractions were removed sequentially from the top of the gradient to the bottom. Floating fraction (FF): isolated CLDs, 1-10: soluble fractions, P: pellet. (B) Western blot of isolated fractions and whole cell lysate (WCL). Fractions were loaded by volume: 10 μL FF-10, 5 μL P and WCL. Membrane was probed for markers of CLDs (PLIN3), cytosol (GAPDH), and endoplasmic reticulum (CANX). Approximate molecular weight markers for each protein are listed. See Supplementary Figure 1 for a representative Ponceau stain reflecting the relative levels of protein in each fraction.
