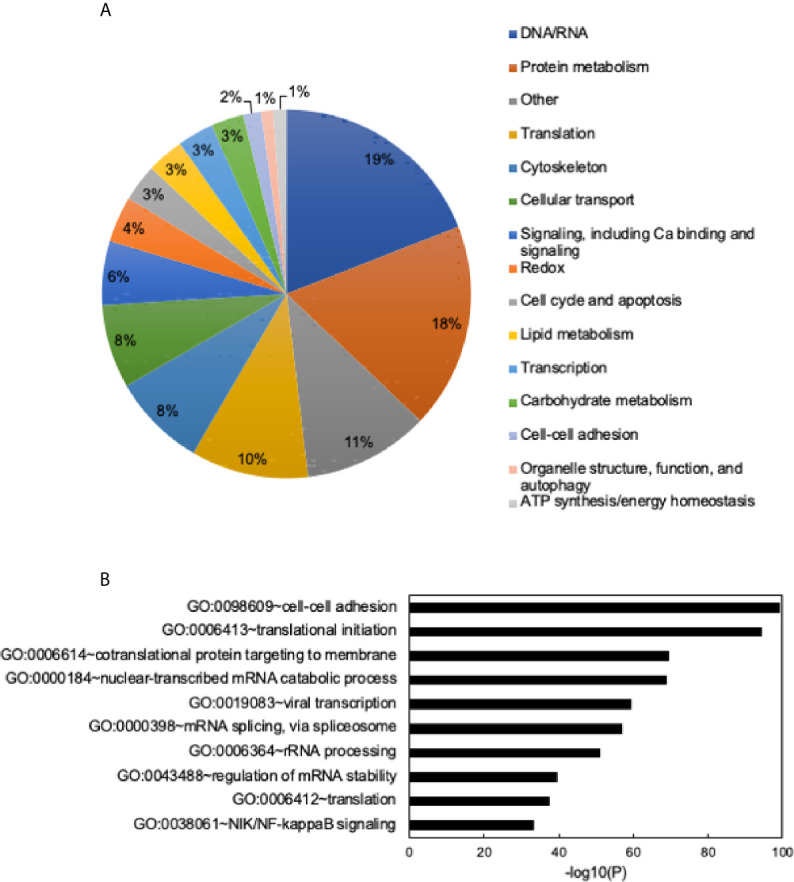
Figure 5.

General functions of identified proteins and Gene Ontology (GO) term enrichment. (A) Identified proteins grouped into general categories. Data shown as a percent of total proteins identified. Categories with the highest to lowest percent of proteins listed from top to bottom and are read clockwise around the pie chart. (B) Chart of the top 10 most enriched Gene Ontology Biological Process (GO_BP) terms. Most to least enriched term listed from top to bottom. Data shown as -log10 (p-value). Enrichment scores/p-values calculated in DAVID. See Supplementary Table 2 for full list of enriched GO terms and enrichment scores.
