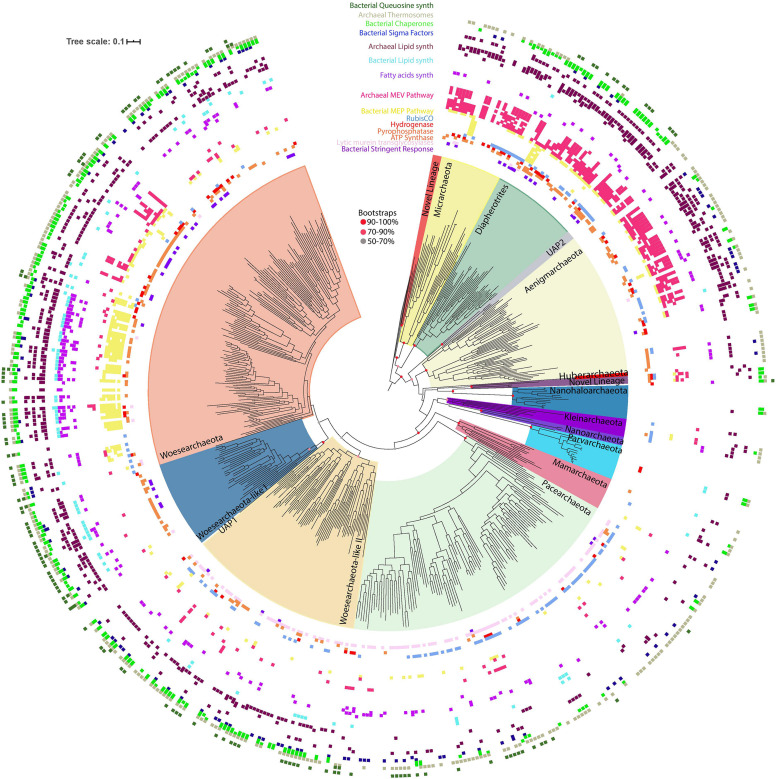
FIGURE 1.
Taxonomic assessment and distribution of the newly DPANN genomes with metabolic similarities and distribution among DPANN lineages. Maximum-likelihood phylogeny of the DPANN lineages using Altiarchaeota as an outgroup and based on a 14-ribosomal-protein concatenated alignment (3,677 amino acids, LG + R10 model). The presence/absence of a subset of targeted metabolic traits is indicated as concentric rings. The scale bar indicates the mean number of substitutions per site. A fully annotated tree with all included lineages, more metabolic features as well as the bootstrap values are available in Supplementary Figure 1.

