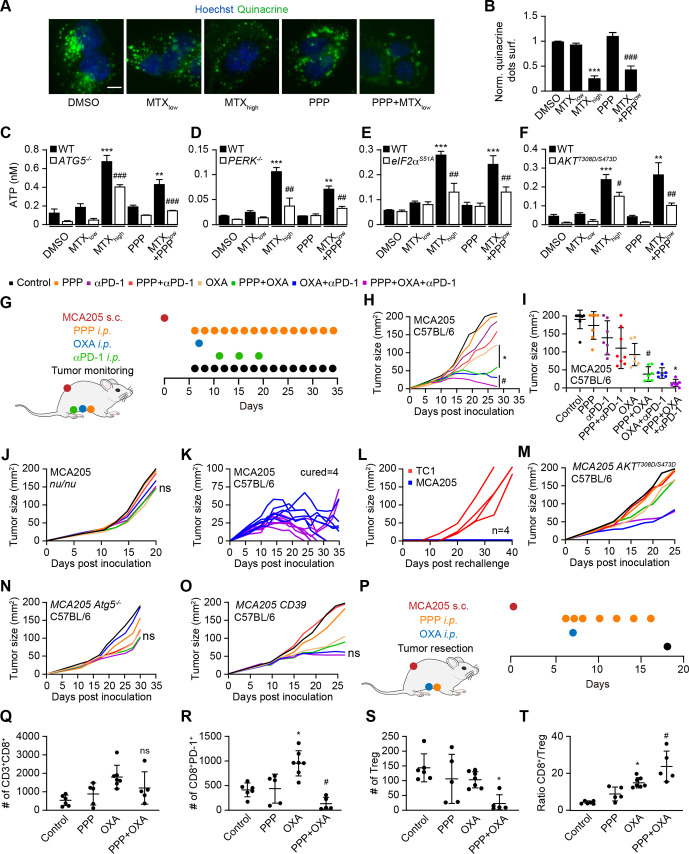
Figure 5.
PPP improves autophagy-dependent anticancer chemotherapy in a T lymphocyte-dependent manner. (A, B) Human osteosarcoma cells were treated with PPP (10 μM) in the presence of a low dose of the ICD inducers mitoxantrone (MTX, 1 μM) for 6 hours. High-dose MTX (5 μM) was used as positive controls. Quinacrine staining was used to monitor intracellular ATP content. Representative images are shown in A and quinacrine dots were quantified in B. Scale bar equals 10 μm. Data are means±SD of three replicates (***p<0.001 vs untreated control; ###P<0.001 vs PPP; Tukey’s multiple comparisons test). (C–F) Human neuroglioma H4 cells wild-type or Atg5 knockout, human osteosarcoma U2OS wild type, PERK knockout or PEIF2α S51A knockin cells, murine fibrosarcoma MCA205 wild-type or AKTT308D/S473D knockin cells were treated with PPP (10 μM) alone or in combination with low doses of the ICD inducers MTX (1 μM) for 6 H as described above. High-dose MTX (5 μM) was used as positive controls. the extracellular ATP levels were measured in C–F. Data are means ± SD of three replicates (**P<0.01, ***P<0.001 vs untreated control; #P<0.05, ##P<0.01, ###P<0.001 vs WT; Tukey’s multiple comparisons test). (G–O) In vivo treatment of implanted murine MCA205 fibrosarcoma with oxaliplatin (OXA), anti-PD-1 antibody and PPP, alone or in combination (schematic view in G). (H, I) Growth kinetic of murine fibrosarcoma MCA205 cells evolving in immunocompetent C57BL/6 mice or athymic nu/nu mice (J) or MCA205 fibrosarcoma expressing constitutive active AKTT308D/S473D (M), Atg5 deficient MCA205 ATG5-/- (N) or MCA205 expressing the ectoATPase CD39 (O) evolving in immunocompetent C57BL/6 mice were treated as indicated in (G). When tumors became palpable, mice received systemic intraperitoneal (i.p.) injections of ppp alone or together with OXA or PD-1 blocker. Data are depicted as growth curves (mean±SD) (H, L–O) and tumor size distributions at day 24 (I). Individual tumor growth curves of mice treated with OXA and PPP, combined or not with PD-1 blockade are shown (K). The generation of immunological memory was assessed in cured animals by rechallenge with MCA205 and TC-1. Individual tumor growth curves are depicted (L). Data were analyzed with TumGrowth. n≥6 for mice in each group. (*P< 0.05 or ns, not statistically significant vs OXA; #P<0.05 or ns, not statistically significant vs OXA+PD-1 blockade, Student’s t-test, survival plots in online supplemental figure S7). (P) Schematic overview of the treatment of implanted murine MCA205 fibrosarcoma with OXA and PPP, alone or in combination. (P–T) Cytofluorometric analysis of tumor-infiltrating lymphocytes (TIL): CD3+CD8+ cytotoxic T lymphocytes (Q), CD8+PD-1+ T lymphocytes (R), CD4+FOXP3+CD25+ regulatory T cells (Treg) (S), and the ratio of CD3+CD8+ T cells over Treg (T). Data are means±SD (n≥5) (*p<0.05 or ns, not statistically significant vs control; #P<0.05 or ns, not statistically significant vs OXA, Student’s t-test). PPP, picropodophyllin.

