Abstract
The monoclonal antibody SMI-32 was used to characterize and distinguish individual areas of cat auditory cortex. SMI-32 labels nonphosphorylated epitopes on the high- and medium-molecular weight subunits of neurofilament proteins in cortical pyramidal cells and dendritic trees with the most robust immunoreactivity in layers III and V. Auditory areas with unique patterns of immnoreactivity included: primary auditory cortex (AI), second auditory cortex (AII), dorsal zone (DZ), posterior auditory field (PAF), ventral posterior auditory field (VPAF), ventral auditory field (VAF), temporal cortex (T), insular cortex (IN), anterior auditory field (AAF), and the auditory field of the anterior ectosylvian sulcus (fAES). Unique patterns of labeling intensity, soma shape, soma size, layers of immunoreactivity, laminar distribution of dendritic arbors, and labeled cell density were identified. Features that were consistent in all areas included: layers I and IV neurons are immunonegative; nearly all immunoreactive cells are pyramidal; and immunoreactive neurons are always present in layer V. To quantify the results, the numbers of labeled cells and dendrites, as well as cell diameter, were collected and used as tools for identifying and differentiating areas. Quantification of the labeling patterns also established profiles for ten auditory areas/layers and their degree of immunoreactivity. Areal borders delineated by SMI-32 were highly correlated with tonotopically-defined areal boundaries. Overall, SMI-32 immunoreactivity can delineate ten areas of cat auditory cortex and demarcate topographic borders. The ability to distinguish auditory areas with SMI-32 is valuable for the identification of auditory cerebral areas in electrophysiological, anatomical, and/or behavioral investigations.
Keywords: Pyramidal cells, Cortical cytoarchitecture, Laminar distribution, Primary auditory cortex
1. Introduction
Brodmann (1909) divided the cerebral cortex of humans and monkeys into 52 different areas based solely on differences in cytoarchitecture. He argued that the human cerebrum is anatomically organized like that of other animals and that a common areal numbering system, across species, would be useful for functional comparisons. Over the past century, many techniques have been developed and successfully used to functionally partition the mammalian cerebral cortex. At present, it is generally recognized that there are five basic approaches, or criteria, that can be used to delineate cortical areas: 1) cyto- or myeloarchitectonic, or histochemical differences; 2) cortical connections; 3) topographic or mapping criteria; 4) differences in neural receptive field properties; and 5) differences in behavior following stimulation or inactivation (Rosenquist, 1985). While many cortical areas can be specified on each of the five criteria, other areas must be distinguished from one another based upon a preponderance of the evidence. While current cyto- and myeloarchitectonic tools such as Nissl and myelin-stains can demarcate cortical laminae accurately, areal differentiations are often more problematic when using these methods.
The monoclonal antibody SMI-32 (Sternberger Monoclonal Inc., Baltimore, MD) recognizes the nonphosphorylated epitopes on the medium and heavy molecular weight subunits of the neurofilament protein (Sternberger and Sternberger, 1983) and clearly labels cortical somata and dendrites. This antibody has been used to subdivide cortex of the old world monkey (eg. Hof and Morrison, 1995; Hof et al. 1995b; Lewis and Van Essen 2000) and cat visual cortex (Van der Gucht et al., 2001). SMI-32 has also been used to identify subdivisions within the cerebellum (Riederer et al., 1996), thalamus (Bickford et al., 1998) and superior colliculus (Fuentes-Santamaria et al., 2006).
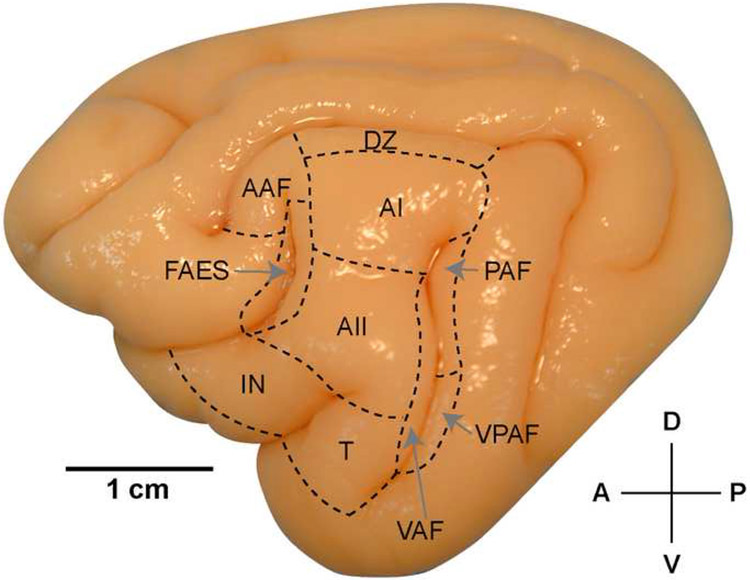
SMI-32 has not yet been extensively utilized to distinguish multiple areas within auditory cortex. Earlier studies examining auditory cortex with SMI-32 have focused on defining primary or core auditory areas in a variety of species (Hof et al., 1992; Budinger et al., 2000; Lewis and Van Essen, 2000; Hassiotis et al., 2004, Ashwell et al., 2005; Wong and Kaas, 2009). In the cat, electrophysiological, anatomical, and behavioral studies have been used to reveal at least ten functionally distinct areas of auditory cortex (Fig. 1). Physiologically, four cortical areas have been identified to have a tonotopic/cochleotopic organization (Woolsey, 1960; Knight, 1977; Reale and Imig, 1980; Phillips and Orman, 1984). Anatomical studies have segregated up to 13 areas in cat auditory cortex based on differences in cytoarchitecture (Rose, 1949; Sanides and Hoffman, 1969; Sousa-Pinto, 1973; Kelly and Wong, 1981), thalamic afferents (Imig and Morel, 1983; Morel and Imig, 1987; Clascá et al., 1997; Huang and Winer, 2000; Lee and Winer, 2008a), cortical afferents (Imig and Reale, 1980; Lee and Winer, 2008c), and afferents from the contralateral hemisphere (Lee and Winer, 2008b). Behaviorally, permanent or reversible deactivation studies of specific loci in auditory cortex (Strominger, 1969; Kelly and Whitfield, 1971; Neff et al., 1975; Malhotra and Lomber, 2007; Lomber et al., 2007; Malhotra et al., 2008; Lomber and Malhotra, 2008) have also confirmed the existence of at least ten auditory areas.
Figure 1.
Lateral view of the left hemisphere of the cat brain. The ten auditory cortical areas identified are labeled. For abbreviations, see List. Scale bar=10mm.
Therefore, the purpose of the present study was to apply SMI-32 as a selective marker for an accurate parcellation of the cat auditory cortex. We were particularly interested in the distribution of neurons containing neurofilament protein in an attempt to delineate cortical areas and to determine the architectonic boundaries between adjacent areas. We were able to analyze the anatomical characteristics of ten auditory areas regarding the morphological and functional features of neurofilament protein-immunopositive neurons and successfully determine the locations of areal borders. Preliminary results have been reported previously in abstract form (Mellott et al., 2005).
2. Materials and methods
Twenty-one adult (>6 months) domestic cats were examined. All procedures were conducted in accordance with the Canadian Council on Animal Care’s Guide to the Care and Use of Experimental Animals (Olfert et al., 1993), the US National Research Council’s Guidelines for the Care and Use of Mammals in Neuroscience and Behavioral Research (2003), and the European Communities Council Directive (November 24, 1986; 86/609/EEC). All procedures were approved by the University of Western Ontario Animal Use Subcommittee of the University Council on Animal Care.
2.1. Tissue preparation
The afternoon prior to the perfusion each cat was fasted, lightly anesthetized with ketamine (20mg/kg, i.m.), and an indwelling feline catheter was inserted into the cephalic vein (to permit administration of anesthetic the next day). The following day, general anesthesia was induced by intravenous administration of sodium pentobarbital (40 mg/kg). Heparin (10,000 U), an anticoagulant, and 1% sodium nitrite (1 ml), a vasodilator, were then given intravenously. Each animal was then perfused through the ascending aorta with saline for five minutes, followed by 4% paraformaldehyde for twenty minutes, and finally 10% sucrose was perfused for five minutes to help cryoprotect the tissue. All solutions were buffered to pH 7.4 with 0.1 Sorenson’s buffer and infused at a rate of 100ml/min. The net effect of the procedures was to exsanguinate the cat, a method consistent with the recommendations of the American Veterinary Medical Association Panel on Euthanasia (Beaver et al., 2001), and to fix tissue for the identification of SMI-32 immunoreactivity. The head was then placed in a stereotaxic apparatus, the brain was exposed, blocked at Horsley-Clarke (1908) coronal level A22, and removed from the cranium. Each brain was photographed to provide a permanent record and, for cryoprotection, placed in 30% sucrose until it sunk.
Brains were frozen, sectioned (50μm thick) coronally (n=10) or sagittally (n=3), and collected serially for the entire cerebrum and thalamus. The first series of sections, at 250 μm intervals, was processed for SMI-32 immunoreactivity. Series 2 was stained with cresyl violet to reveal the presence of Nissl bodies. Series 3 was processed histochemically to demonstrate the presence of cytochrome oxidase (CO) using procedures described in previous studies (Wong-Riley, 1979; Payne and Lomber 1996). Series 4 was processed for myelin, using the hemotoxylin method of Jebb and Woolsey (1977). Selected sections from series 5, as needed, were processed using any of the previously described methods.
2.2. Immunocytochemistry
Sections were rinsed for 5-10 mins (0.01M PBS), reacted for 20 mins in 0.3% H2O2, rinsed four more times (5 mins each), then preincubated for 60 mins in normal goat serum (NGS/5%). The free-floating sections were then incubated overnight in the primary antibody (SMI-32; 1/2000 or 1/4000) at 4oC with 2% NGS. The next morning, tissue was rinsed again four times in PBS and then incubated in biotinylated second antibody, goat anti-mouse IgG (1/200; 30 mins) (Vector Laboratories, Burlingame, CA). After further rinses, incubation for 60 mins with an avidin-biotin-horseradish peroxidase solution followed (Vectastain Elite ABC, Vector, Burlingame, CA). After a final rinse sections were then mounted onto gelatin-coated slides, air dried, cleared with xylenes and coverslipped.
2.3. Data analysis
Tissue was analyzed using standard light/dark field microscopy with Neurolucida and accompanying NeuroExplorer software (MBF Bioscience, Inc., Williston, VT). For somatic and dendritic counts and somata diameter, Nikon E1000M and 80i microscopes, equipped with Nomarski DIC imaging and Nikon digital cameras (Nikon, Melville, NY) with accompanying ACT-1 software, were used. Quantitative measures were taken from vertical traverses of six cases. In each case, five coronal 50μm sections from the left hemisphere were sampled from each of the ten areas examined. Layers were identified in adjacent Nissl stained sections and in the SMI-32 sections. Somata counts were made at 500μm wide samples, and dendritic counts were made at 50μm wide samples. In each section, samples were taken at the center of a given area as determined by qualitative measures. Statistical significance for the somatic and dendritic counts was determined using an analysis of variance with follow-up t-tests. Within the Results section, unless otherwise stated, if a difference is described as being significant or reliable, it was ≤0.01 level of significance.
2.4. Tonotopic mapping
Acoustically-evoked responses were measured in the right hemisphere in three of the twenty-one animals. Twenty-four hours prior to surgery, all cats were anesthetized with ketamine (20 mg/kg i.m.) and the cephalic vein was cannulated with a feline indwelling catheter. Dexamethasone (1.0 mg/kg i.v.) was administered to reduce inflammation during surgical and electrophysiological recording procedures. All animals were then fasted overnight. On the day of surgery, anesthesia was induced by an injection of sodium pentobarbital (25 mg/kg i.v.) (Cheung et al., 2001) followed by supplemental doses as needed. Electrocardiogram and blood oxygen concentration were monitored to ensure proper levels of anesthesia. A second dose of dexamethasone was given, and atropine (0.03 mg/kg s.c.) was administered to reduce respiratory and alimentary secretions. A rectal probe was used to monitor body temperature. Core temperature was maintained at 37°C using a water-filled heating pad (Gaymar, Orchard Park, NY). Animals were hydrated using an infusion pump supplying 2.5% dextrose/half-strength lactated Ringers (4 ml/kg/h i.v.). In addition, dexamethasone (1.0 mg/kg i.v.) and atropine (0.03 mg/kg s.c.) were administered every 12 hours for the duration of the experiment (36 to 84 hours). To ensure adequate ventilation, the mucosa of the pharynx was anesthetized with a topical anesthetic (Cetacaine, Cetylite Laboratories, Pennsauken, NJ) to inhibit the gag reflex, and the trachea was intubated with a cuffed endotracheal tube. Respiration was unassisted. The animal was then positioned in a stereotaxic frame (David Kopf Instruments, Tujunga, CA) and the head was fixed by palato-orbital restraints and blunt (non-rupture) ear bars. Ophthalmic ointment (Neosporin, Kirkland, Quebec) was applied to the cornea to prevent desiccation. A midline incision was made in the scalp and the right temporalis muscle was detached medially and reflected laterally. A craniotomy was made over the anterior and middle ectosylvian gyri. A head holder was attached to the frontal bone of the skull with dental acrylic and secured to the stereotaxic frame via a carrier. The ear bars and palato-orbital restraints were then removed to permit the unobstructed access of acoustic signals and to minimize pressure points on the animal. The dura was resected and a layer of silicone oil was applied to the cortex to prevent desiccation. With the aid of a surgical microscope a digital image of the exposed cortical region was taken to maintain a record of the position of each penetration in reference to the cerebral vasculature.
2.4.1. Stimulus generation and presentation
Recordings took place on an electrically shielded, vibration-free table (Technical Manufacturing Corporation, Peabody, MA) within a double-walled sound chamber. Pure tones were calibrated using a 1/4th inch microphone (Brüel and Kjäer, 4944, Naerum, Denmark) and Tucker–Davis SigCal software. Acoustic signals were presented in the free-field 15 cm from the left ear, measured at the center of the head, and were digitally generated with a 24-bit D/A converter at 156 kHz (Tucker-Davis Technologies, Alachua, FL). Frequency-intensity receptive fields were obtained at each recorded site by presenting 2064 pure tones (5 msec rise and fall times, cosine squared gated, 25 msec total duration) in a pseudo-random order chosen from 16 intensities ranging from 0 to 75 dB SPL in 5 dB steps, and 129 frequencies in 1/16-octave steps ranging from 250 Hz to 64,000 Hz. Two sound transducers were utilized; signals with frequencies less than 24,000 Hz were delivered from a TS-AI072R speaker (Pioneer, Long Beach, CA) and signals with frequencies ranging from 24,000 Hz to 64,000 Hz were delivered from an EC1 sound transducer (Tucker-Davis Technologies). The speakers were placed immediately adjacent to each other during calibration and stimulus delivery. Each frequency-intensity combination was presented once at a rate of 2.5 Hz.
2.4.2. Recording procedures
Parylene-coated tungsten microelectrodes with a 2x1 configuration and impedances of 1 to 2 MΩ at 1,000 Hz were utilized (FHC, Bowdoinham, ME). The electrodes were positioned orthogonally to the cortical surface and lowered into auditory cortex with a hydraulic microdrive (Narashige, MO-95, Tokyo, Japan). Differences in cortical laminae responses were minimized by recording neuronal responses at ~1,200 microns from the cortical surface (layer IV/V). In order to increase the likelihood of consistent laminae recording all microelectrode penetrations were limited to the gyral surface circumscribed by the banks of the suprasylvian sulcus (ss), the anterior ectosylvian sulcus (aes), and the posterior ectosylvian sulcus (pes). Recordings were bandpass filtered (500 Hz to 5,000 Hz), amplified (x10,000) and digitized at 25,000 Hz. Data acquisition was performed using Tucker-Davis Technologies System 3 hardware and software (OpenEx). During the first 24 hours of each recording procedure, frequency-intensity receptive fields were derived at different locations of auditory cortex to delineate the borders of primary auditory cortex (AI) and the anterior auditory field (AAF). During these recordings, microelectrode penetration sites were chosen to avoid damage to blood vessels while generating a complete and evenly spaced cortical map. A clear distinction between AI and AAF was established based on the reversal of tonotopic organization (Merzenich et al., 1975; Knight, 1977; Reale and Imig, 1980; Imaizumi et al., 2004). At the end of electrophysiological mapping, the animals were perfused and the brains were histologically processed as described earlier.
2.4.3. Data analysis
AI and AAF were defined on the basis of their short response latency (8 to 25 msec) and continuous tonotopy (Imaizumi et al., 2004). Their mutual border was delineated by a reversal of tonotopic organization, with highest frequencies represented at the border. All other boundaries were determined using non-responsive and non-AI/AAF sites. The recorded receptive fields were randomized and analyzed by a blind observer to determine characteristic frequency, which is defined as the tone frequency that evokes a reliable response at the lowest intensity level. Characteristic frequency maps were constructed by generating Voronoi tessellations as we have done in earlier publications (Carrasco and Lomber, 2009a,b).
3. Results
In the first portion of the Results we describe general characteristics of SMI-32 immunoreactive auditory cortex and how areal borders are classified. The second portion of the Results focuses on individual areas of auditory cortex, the borders between them, and the quantitative results. Each area is discussed beginning with centrally located AI, those areas that surround AI and, lastly, those areas that do not share a border with AI and are more temporally located. The borders between two areas are presented after each individual area has been described. In the final portion of the Results the tonotopically defined AI/AAF border is compared to the same border delineated by SMI-32.
3.1. General features of SMI-32 immunoreactivity
In auditory cortex, cells immunoreactive for SMI-32 can be identified in both infra- and supragranular layers (Fig. 2), particularly in layers IIIb and Va, as confirmed in adjacent Nisslstained and CO-reacted sections. Many auditory areas have weak to moderate somata immunoreactivity in layers II, IIIa and VI. Across auditory cortex, layers I and IV contain no immunoreactive neurons. Immunopositive layer V pyramidal cells are observed in all areas of auditory cortex and are consistently the most intensely reactive cells. Furthermore, it is observed that as soma size increases, so does the immunoreactive intensity of the SMI-32 label. These findings were consistent, regardless of which of the three laboratories prepared the tissue.
Figure 2.
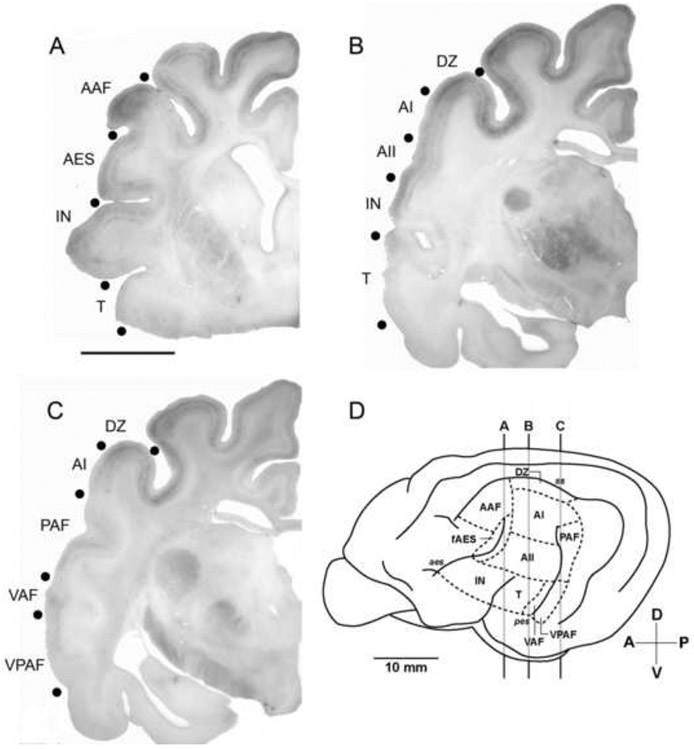
Macroscopic views of coronal sections showing SMI-32 immunoreactivity. Even at low magnification the areal boundaries between neighboring regions and differing intensities can be identified (filled black circles). A: The anterior-most cortical regions identified (AAF, fAES, IN) and surrounding area (T). Dorsal regions were more heavily reactive, specifically within layer III, than the ventral regions, IN and T. Scale bar = 1cm and applies to A, B, & C. B: Middle ectosylvian regions (AI, AII, T) and neighboring regions (DZ, IN). C: Posterior ectosylvian regions (PAF, VPAF) along with middle ectosylvian VAF and neighboring regions (DZ, AI). D: Lateral view of the left cerebrum identifying the coronal positions of sections A, B and C. For abbreviations, see List.
A common characteristic observed throughout auditory cortex is the labeling of apical dendrites. Frequently, the first bifurcation of labeled apical dendrites is evident and serves as a measure to distinguish two neighboring regions. In most areas, label intensity is positively correlated with somata size. The larger and wider a cell or dendrite, the higher the likelihood the cell or dendrite will display a more intense immunoreactivity. The largest cells (>40μm in diameter) typically reside in the more dorsal areas (AI, DZ, AAF, and PAF).
Following the same theme, the comparison of AAF and VPAF was the first indication that there is a gradient in non-phosphorylation epitopes across auditory cortex. The AAF profile is the densest and most reactive of all ten profiles (Fig. 2A). AAF also occupies the most anterodorsal position within auditory cortex. While AAF is dense with label, VPAF has the weakest immunoreactive profile (Fig. 2C). VPAF is located in the most ventroposterior extent of auditory cortex. Therefore, in auditory cortex, there is a dorsal to ventral gradient of SMI-32 immunoreactivity with dorsal areas having the highest reactivity and ventral areas having the lowest reactivity.
3.2. Areal border classifications
Differences in SMI-32 expression intensity, somata shape and size, laminar immunoreactivity and distribution of dendritic arbors, and densities between neighboring cortical areas, provided sufficient data and contrasts to delineate borders between the different auditory cortical areas. Although some areal borders were more difficult to define than others, all borders were discernable. We defined three border types based on SMI-32 immunoreactivity: 1) Borders readily discernable between two cortical areas we refer to as “clear-cut”. These areal borders were often determined with the naked eye because of the abrupt profile change. 2) Most borders are defined as “transitional”. These areal borders were clearly defined, but with more subtle profile and pattern differentiations. 3) Those areas adjacent to fAES create an areal border we define as “indefinite”. Quantitative analysis for fAES could be established, however, descriptive analysis was highly dependent on the conformation of fAES at the location of the tissue section. The conformation of the anterior ectosylvian (AE) sulcus routinely changes course, though always with an anteroventral to dorsoposterior orientation. The most dorsoposterior extent of the sulcus dives deep to AI, creating a medial to lateral component in the sulcus’ orientation. When tissue is cut in the coronal plane, it is nearly impossible to determine if much of the SMI-32 labeling observed throughout the AE sulcus is truly perpendicular to the cut. Overall, each of the areas of auditory cortex examined has a unique SMI-32 immunoreactivity profile with discernable borders among the different areas.
3.3. Primary auditory cortex (A1)
A1 occupies the dorsal half of the middle ectosylvian gryus (Fig. 2D). SMI-32 expression is moderate and homogeneous within layers II, III, V and VI. The densest immunolabeling is in layer IIIb and upper layer V (Fig. 3A). SMI-32 clearly demarcates the layers of primary auditory cortex at low (Fig. 3A) and high magnification (Fig. 3C). Identification of the subdivisions of layers III and V is also possible using SMI-32 expression (Fig. 3C). In areas where SMI-32 immunolabeling is extensive, laminar delineation is often more readily apparent than in adjacent Nissl sections (compare Figs. 3A, B). Bifurcations of apical dendrites originating from layer V are observable with SMI-32 labeling (Fig. 3D, asterisk), which is common among the cortical areas with the densest labeling. Layers I and IV are devoid of any somatic immunoreactivity as in all auditory areas. The only observed dendritic immunolabeling in layer IV is from the labeled apical dendrites of layer V neurons. While there is little staining of layer II somata, some apical dendrites originating in layers III and V terminate in layer II. These immunopositive dendritic fields give layer II a moderate staining profile that helps distinguish AI from neighboring dorsal cortical areas (described later). Layer VI somata are lightly stained, though their dendritic branches/arbors are moderate in their reactivity.
Figure 3.
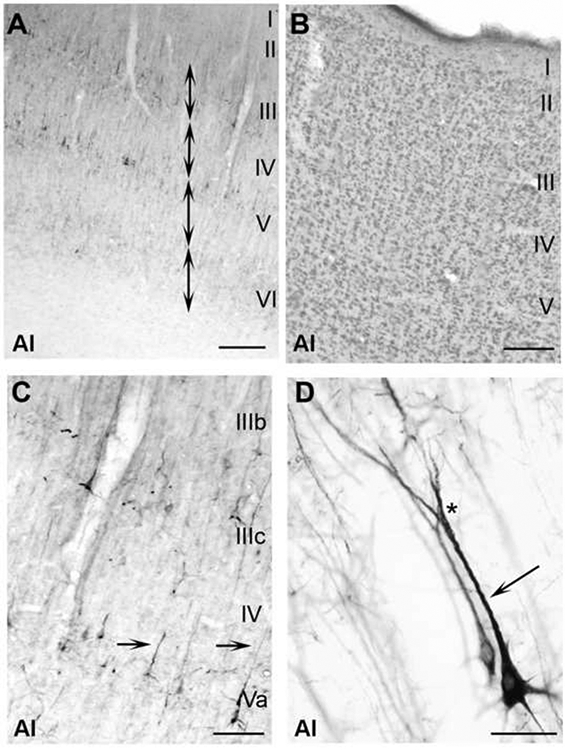
Neurofilament protein expressed within AI depicting characteristic properties of the SMI-32 labeling. A: Reactive profile of each layer spanning AI. Note that most reactivity lies within layers III and V. Layers I and IV are barren of SMI-32 expression, which is consistent throughout each of the other nine auditory cortical areas. Double-headed arrows show that through SMI-32 application, laminar organization can be identified. B: Adjacent section to (A) reacted for the presence of Nissl. C: Photomicrograph at x100 revealing characteristics of reacted somata and dendrites. Arrows indicate apical dendrites that arose from layer V somata. Most apical dendrites and their corresponding somata were immunoreactive. D: A layer V pyramidal cell intensely immunoreactive to the SMI-32 antibody at x600. The arrow shows the well reacted apical dendrite. The asterisk indicates dendritic bifurcation. Well labeled bifurcations of layer V pyramidal calls are a prominent feature of AI. Scale bars: A and B=300μm; C=200μm; D=40μm.
3.4. Anterior auditory field (AAF)
AAF is located anterior to AI on the anterior ectosylvian gryus (Fig. 2D). The SMI-32 staining profile of AAF has a distinctive reactivity with robust and heavy labeling evident in the supragranular layers (Fig. 4A). One of the most profound AAF characteristics is the denseness and opaqueness of large (>40μm) layer V pyramidal cells (Fig. 4B, arrows). Layers III and V contain homogenous bands of dense dendritic immunoreactivity (Figs. 4A, B).
Figure 4.
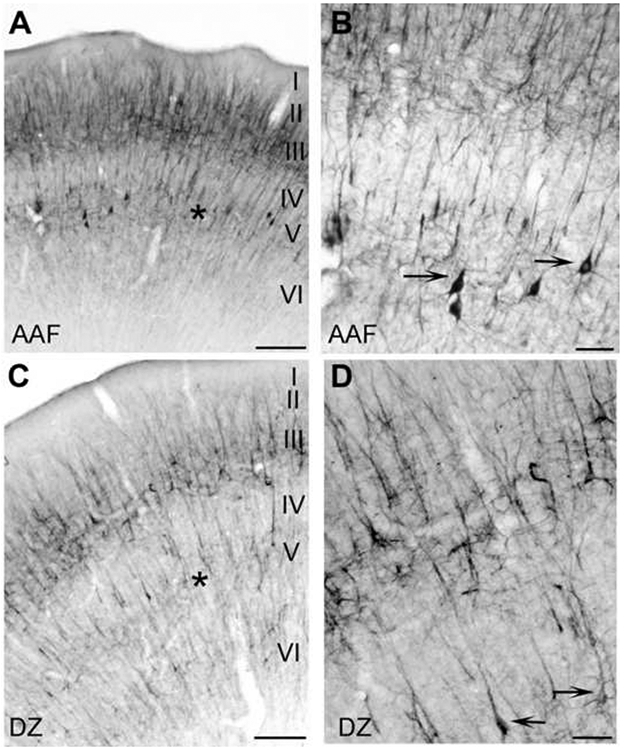
Expression profiles of dorsal regions AAF (A, B) and DZ (C, D) at x40 (A, C) and x100 (B, D). A: SMI-32 reactivity across all cortical layers of AAF. AAF is characterized by an intense reaction, particularly layers II, III and V. Asterisk indicates layer V. B: Higher magnification (x100) of SMI-32 expression in AAF. Arrows indicate layer V somata. Robust labeling of large (>30μm) pyramidal cells throughout layer V is a unique characteristic of AAF. C: Photomicrograph of SMI-32 expression throughout all cortical layers of DZ. A distinguishing feature of DZ is the strong reactivity throughout layers II and III. Note that layer V in AAF was more intensely labeled than layer V of DZ (asterisks). D: Higher magnification (x100) of SMI-32 expression in DZ. Arrows indicate layer V somata reactive to SMI-32. Scale bars: A and C =400μm; B and D=100μm.
3.4.1. AI/AAF border
As seen in sagittal sections, SMI-32 immunostaining profile changes gradually between AAF and AI (Fig. 5). AI has moderate homogeneous immunoreactivity throughout its four reactive layers. AAF has a much heavier and dense appearance that allows for demarcation from AI (Fig. 5). The density of layers III and/or V is the most reliable measure to demarcate the border between differing laminar profiles. Qualitatively, SMI-32 intensity is greater across layers II, III, and V in AAF than it is in AI. The most striking difference between AAF and AI are the layer V pyramidal cells and how much more intensely reactive the cells are in AAF (Fig. 5). Figure 5 shows the similarity of the AI/AAF border in two different cases reacted for SMI-32 (compare Figs. 5A&B). Quantification of immunoreactive somata in AI and AAF confirms the qualitative differences described at the border (Fig. 6A). Somata reactivity is significantly denser in layers II, III, and V of AAF compared to AI (Fig. 6A). The border between AAF and AI is classified as transitional.
Figure 5.
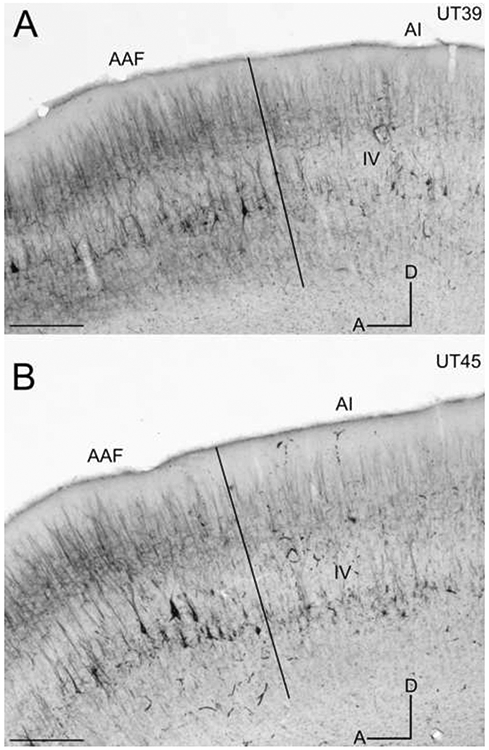
SMI-32 immunoreactivity in sagittal sections through the middle ectosylvian gyrus. Layer IV is labeled in each and borders are marked by black lines. A: The AI/AAF border at x200 in case UT39. B: The AI/AAF border at x200 in case UT45. D=dorsal; A=anterior. Scale bars: A&B = 1000μm.
Figure 6.
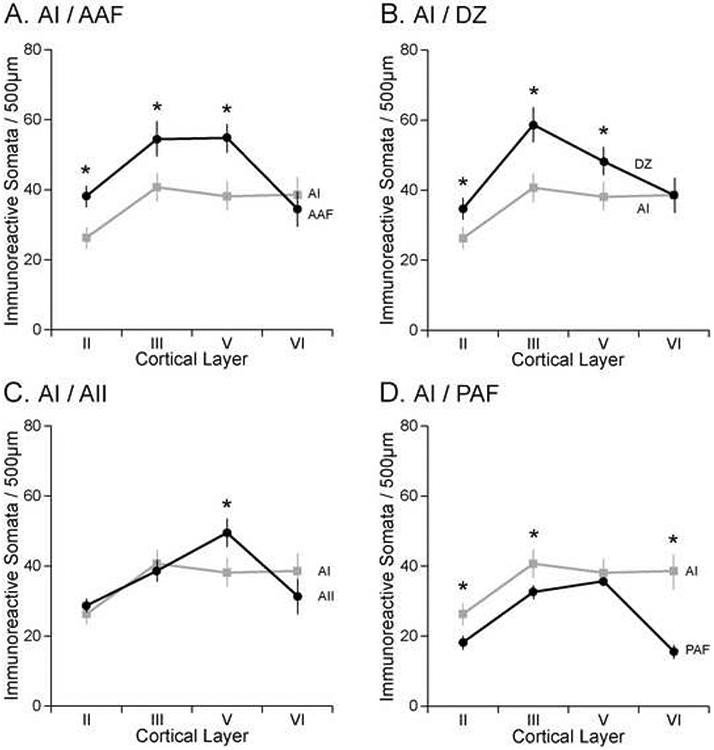
Comparison of somata immunoreactivity between AI and each of its neighbors. A: AAF, B: DZ, C: AII, D: PAF. Each border shown is transitional. Graphs show mean ± SE immunoreactivity in each of the four immunoreactive layers (II, III, V, VI). Asterisks indicate significant difference at p<0.01.
3.5. Dorsal zone (DZ) of auditory cortex
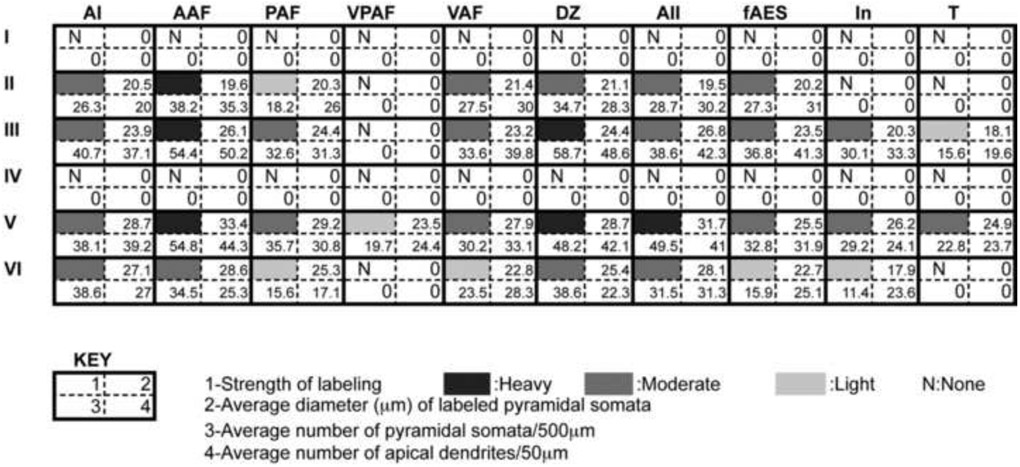
DZ is positioned dorsal to AI at the dorsomedial edge of the middle ectosylvian gyrus (Fig. 2D). Much like AAF, DZ characteristically has heavy immunoreactivity throughout the supragranular layers (Figs. 4C, D). While neuropil labeling is highly reactive in DZ, there is also an increased density of dendritic arbors that when combined, gives the supragranular layers a darker appearance relative to the other laminae (Fig. 4C). DZ’s average dendritic number for layer III, per 50μm swathe (48.6±4.4), is significantly higher than the average across layer III of all auditory cortex (34.5±6.7; Table 1). Similar to AAF, DZ is heavily immunoreactive throughout layer III (Figs. 4C, D). Labeled cells of larger size (>30μm) are often observed throughout layer V (Fig. 4D, arrows). Immunoreactivity in layer VI is light in somata and moderate in dendrites (Fig. 4C). Supragranular dendritic arbors are commonly more expansive yet, not as intensely reactive as those found within layer V (Fig. 4C).
Table 1.
Quantification of cell labeling, pyramidal cell diameter and number, and number of apical dendrites in each of the ten areas of cat auditory cortex identified with SMI-32 immunoreactivity.
 |
3.5.1. AI/DZ border
The defining areal contrast between DZ and AI, is the high density of somata and dendrites labeled throughout layers III and V of DZ (Fig. 7). The number of dendrites per 50μm swathe is significantly higher in DZ (48.6±4.4) than in AI (37.1±3.8; Table 1); and the number of somata per 500 μm swathe is also significantly higher in DZ (58.7±3.9) than that of AI (40.7±5.2; Fig. 6B). Somata reactivity is significantly denser in layers II, III, and V of DZ compared to AI (Fig. 6B). Figure 7 shows the similarity of the AI/DZ border in three different cases reacted for SMI-32 (compare Figs. 7A-F). Given that the changes between DZ and AI are not abrupt, this border is defined as transitional.
Figure 7.
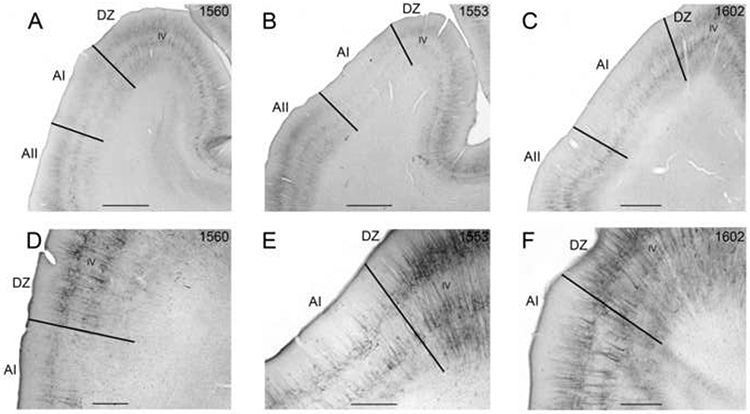
SMI-32 immunoreactivity in coronal sections through AI of three cases. Layer IV is labeled in each and borders are marked by black lines. A-C: Low magnification photomicrographs of AI in cases 1560, 1553, and 1602. D: The AI/DZ border at x200 in case 1560. E: The AI/DZ border at x400 in case 1553. F: The AI/DZ border at x400 in case 1602. Scale bars: A-C = 2000μm; D-F = 1000μm.
3.5.2. AAF/DZ border
The dominant feature of AAF that made areal differentiation between AAF and DZ possible is the density profile in layer V of AAF. When compared to DZ, it is readily observable that layer V of AAF is more reactive and denser than layer V of DZ (Fig. 4A, C, asterisks). The supragranular layers of AAF have the densest labeling of any area within auditory cortex and are more robust than the supragranular labeling in DZ (compare Figs. 4A and 4C). Similar to the AI/DZ border, AAF/DZ is also transitional in nature.
3.6. Second auditory cortex (AII)
AII is located at the union of the middle ectosylvian and sylvian gyri, situated between the anterior and posterior ectosylvian sulci (Fig. 2D). The dorsal border of AII is AI (Figs. 1, 2B, 2D). This area is distinctive for its heavy neuropil labeling throughout layer V and larger somata labeling (Figs. 8A, C, D). Of the auditory areas, the second largest population of immunoreactive pyramidal cells is found in layer V of AII (Figs. 8A, C; Table 1). Often, the layer V pyramidal cells are thoroughly labeled by the presence of the SMI-32 antibody (Figs. 8C, D). Large basal and apical dendrites are regularly observed (Figs. 8C, D, arrows). In addition, axon bifurcations are routinely labeled (Fig. 8D, asterisk).
Figure 8.
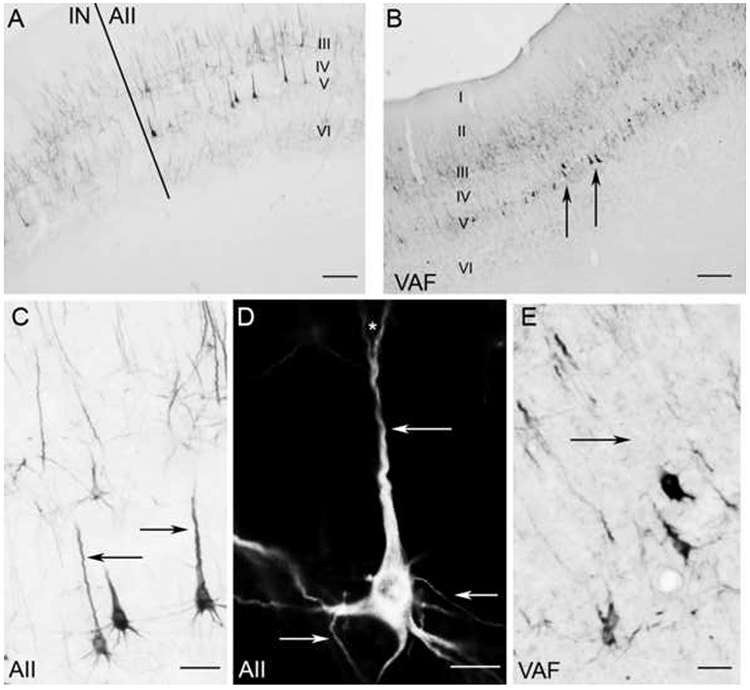
SMI-32 reactivity in the middle ectosylvian areas AII (A,C,D) and VAF (B,E) A: Border of AII and neighboring cortical region IN. B: Low magnification photomicrograph of SMI-32 expression in VAF. Note heavy reactivity in layer V somata (arrows). C: Magnification (x100) of AII layer V somata. Arrows indicate the characteristic well labeled apical dendrites. D: A layer V pyramidal cell in AII at x600 under darkfield illumination. Arrows indicate the well defined dendrites that were commonly identified. The asterisk indicates a commonly observed bifurcation in an apical dendrite. E: Layer V somata in VAF at x100. The arrow shows the lack of a well-labeled apical dendrite, which is commonly absent from layer V somata in VAF. Scale bars: A and B=500μm; C and E=50μm; D=40μm.
3.6.1. AI/AII border
Determining the border between AII and AI is based solely on infragranular analysis. The distinction between layer V pyramidal reactivity is the key criteria used to differentiate AII from AI (compare Figs. 7A-C). Layer V of AII contains more labeled neurons and typically larger (>30μm) pyramidal cells than layer V of AI (Table 1). Somata reactivity is only significantly denser in layer V of AII compared to AI (Fig. 6C). Figure 7 shows the similarity of the AI/AII border in three different cases reacted for SMI-32 (compare Figs. 7A-C). This border is classified as transitional.
3.7. Ventral auditory field (VAF)
VAF is located along the anterior bank of the ventral third of the posterior ectosylvian sulcus (Fig. 2D). Characteristically, VAF is immunoreactive in layers II, III, V, and VI. However, layers III and V are visibly more robust than II and VI (Fig. 8B). Similar to previously described areas, layer V is the predominant layer for dense labeling and larger reactive somata. However, unlike AII somata, apical dendrites labeled in VAF are often “truncated” (compare arrows in Fig. 8C (AII) with Fig. 8E (VAF)). Most of these robust layer V somata do not have labeled apical dendrites or numerous basal dendrites (Fig. 8E, arrow). Lastly, SMI-32 immunoreactivity is weaker in more ventral portions of VAF. While the extent of detail, cell count, and laminar specificity never significantly changes, the overall intensity of the label wanes at the ventral extreme of VAF.
3.7.1. VAF/AII Border
The demarcation of the VAF/AII border is evident by two defining characteristics. The first notable difference is the extent in which each region’s layer V somata reacted. In VAF, apical and basal dendrites are often not labeled and those that are labeled are rarely as densely labeled as dendrites in AII (compare arrows Figs. 8B, C, and E). Second, at the border between VAF and AII, there is an observable delineation of SMI-32 density in layer VI. The number of cells per 500μm swathe through layer VI of VAF (23.5±2.8) is significantly less than that in AII (31.5±4.7; Table 1). This border was classified as transitional.
3.8. Posterior auditory field (PAF)
PAF is located dorsally on the posterior bank of the posterior ectosylvian sulcus and the anterior region of the posterior ectosylvian gyrus (Fig. 2D). The robustness of layer V somata and apical dendrite labeling is the most striking SMI-32 feature in PAF (Figs. 9A, B). Many immunoreactive pyramidal cells in layer V are as large as 35μm (Fig. 9B). Well defined apical dendrites and immediate basal dendrite branching are also commonly observed in PAF (Fig. 9B, arrows). Along with the dense pyramidal cell profile of layer V, moderate somatic and dendritic immunoreactivity is also evident throughout layer III (Fig. 9A). PAF is the only dorsal area that has sparse immunoreactivity in layer II (Fig. 9A).
Figure 9.
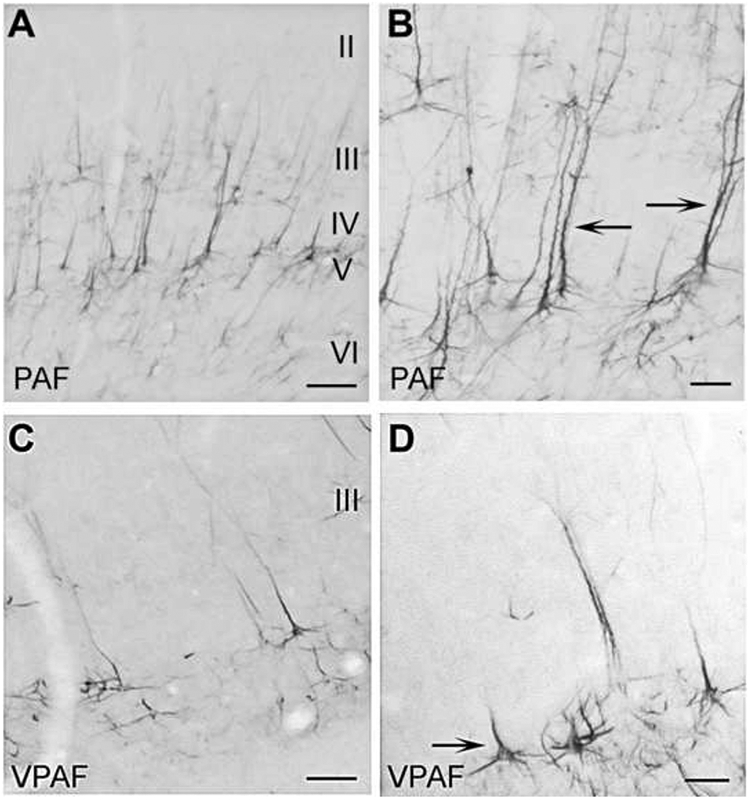
SMI-32 expression in the posterior ectosylvian regions PAF (A,B) and VPAF (C,D). A: PAF has a moderate expression of SMI-32 throughout the supra- and infragranular layers. B: Many labeled pyramidal cells in layer V also have highly reactive apical dendrites (arrows). C: In contrast to PAF, VPAF has weak to no reactivity evident in the supragranular layers. D: Smaller, truncated somata are characteristic of VPAF layer V. Scale bars: A and C =300μm; B and D =40μm.
3.8.1. AI/PAF border
Two profile characteristics are largely responsible for the discernable border between PAF and AI. First, a reduction of SMI-32 labeling throughout layers II and VI of PAF serves as a defining characteristic. The number of pyramidal cells labeled in PAF per 500μm swathe in layers II, III, and VI is significantly less than that observed in AI (Fig. 6D). Overall, AI has denser SMI-32 reactivity than PAF. The border of PAF and AI is classified as transitional.
3.8.2. PAF/VAF border
The PAF/VAF border has similar supragranular characteristics as those observed at the PAF/AI border. The key profile characteristics of PAF that distinguishes it from VAF are the decline of immunoreactivity and the density of label throughout the supragranular layers (Figs. 9A, C). The number of pyramidal cells labeled per 500μm swathe in layer II of PAF (18.2±2.8) is significantly less than that observed in VAF (27.5±3.6; Table 1). Similar to AI, VAF has denser neuropil reactivity than PAF throughout layers II and III (compare Figs. 8B and 9A). The infragranular layers of VAF and PAF have very similar characteristics, however PAF contains larger and more immunoreactive layer V pyramidal cells (compare Figs. 8E and 9B). The border is classified as transitional.
3.9. Ventral posterior auditory field (VPAF)
VPAF is the ventral neighbor of PAF and is situated on the ventral end of the posterior bank of the posterior ectosylvian sulcus (Fig. 2D). The expression of any neurofilament protein is virtually restricted to layer V of VPAF (Fig. 9C). Few, if any, immunoreactive somas or dendritic arbors are found in the supragranular layers (Fig. 9C). Soma size is significantly less than the average of labeled layer V pyramidal cells across auditory cortex (28.0±1.4μm; Table 1). Within auditory cortex, VPAF is the least reactive in the presence of the SMI-32 antibody.
3.9.1. VPAF/VAF border
Microscopic observation is not needed to observe the abrupt profile change between these two areas (Fig. 2C). The only labeling that occurs with any regularity in VPAF is in layer V (Figs. 9C, D, arrow). In VAF there is characteristic labeling in the supragranular layers, while in VPAF there is an absence of label throughout the supragranular layers. The intensity of what little label is observed within VPAF is minimal compared to that of VAF (compare Figs. 8B and 9C). Somata immunoreactivity in VAF is significantly higher in layers II, III, V, and VI when compared to VPAF (Fig. 10A). The VPAF/VAF border is one of only a small number of borders that is defined as “clear-cut”.
Figure 10.
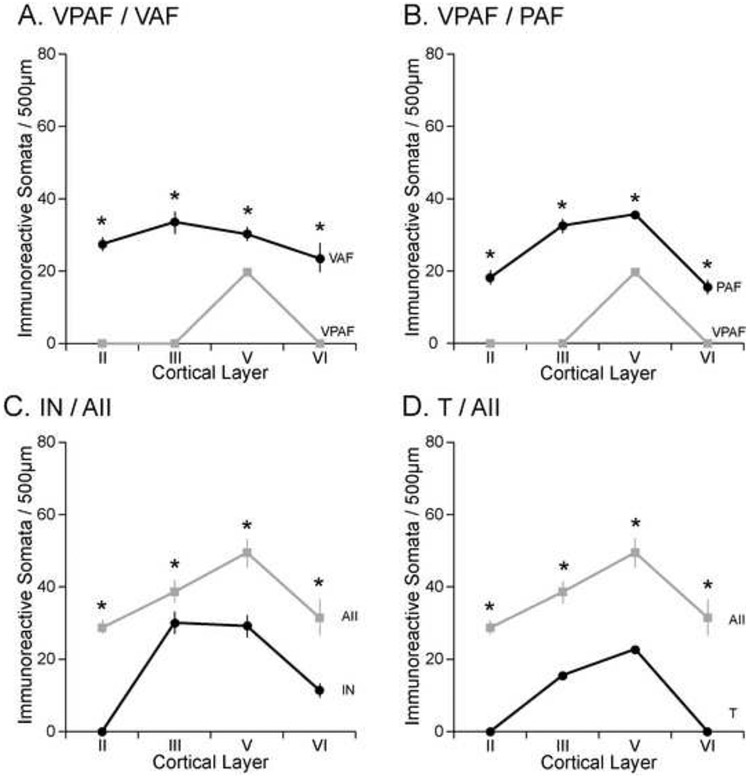
Comparison of somata immunoreactivity between areas that form “clear-cut” borders. A: VPAF/VAF, B: VPAF/PAF, C: IN/AII, D: T/AII. Graphs show mean ± SE immunoreactivity in each of the four immunoreactive layers. Asterisks indicate significant difference at p<0.01.
3.9.2. VPAFV/PAF border
SMI-32 is commonly reactive in both the supragranular and infragranular layers of PAF, while in VPAF the immunoreactivity is restricted to layer V (Fig. 11). Figure 11 shows the similarity of the VPAF/PAF border in three different cases reacted for SMI-32 (compare Figs. 11A-C). Somata immunoreactivity in PAF is significantly higher in layers II, III, V, and VI when compared to VPAF (Fig. 10B). The VPAF/PAF border is “clear-cut”.
Figure 11.
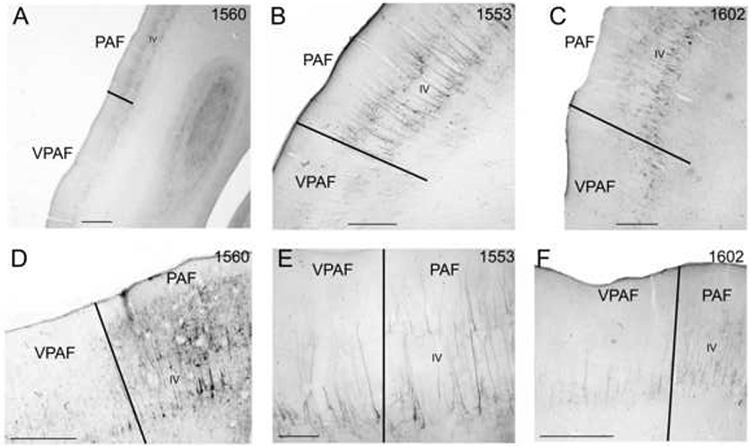
SMI-32 immunoreactivity in coronal sections through the posterior ectosylvian gyrus. Layer IV is labeled in each and borders are marked by black lines. A-C: Low magnification photomicrographs of the PAF/VPAF border in cases 1560, 1553, and 1602. D: The PAF/VPAF border at x200 in case 1560. E: The PAF/VPAF border at x400 in case 1553. F: The PAF/VPAF border at x200 in case 1602. Scale bars: A = 2000μm; B-D&F = 1000μm; E = 500μm.
3.10. Insular cortex (IN)
Area IN resides between the ventral extent of the anterior ectosylvian sulcus and the dorsal extent of the rhinal sulcus (Fig. 2D). Small numbers of weak to moderately stained neurons are indicative of IN (Fig. 12A, arrows; B, sagittal). SMI-32 labeling is greatest in layer V, though some SMI-32 reactivity can be identified in layers III and VI (Fig. 12A, arrows). Layer II is absent any neuropil or neuronal labeling (Fig. 12A). The presence of elaborate dendritic fields or dense clusters of cells is absent. There is also an absence of large (>30μm), labeled pyramidal cells within layer V (Fig. 12A,B).
Figure 12.
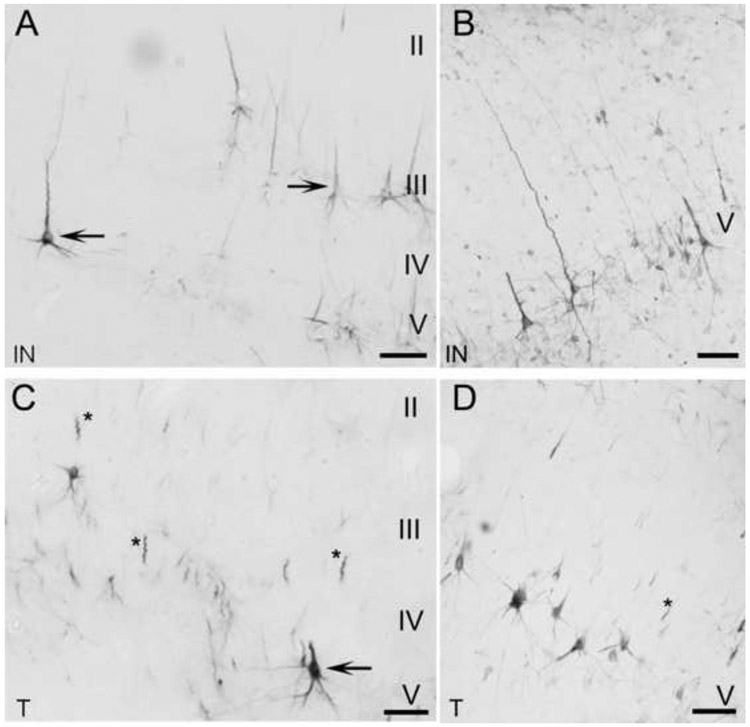
SMI-32 expression profiles in limbic areas IN (A,B) and T (C,D). A,C are coronal sections and B,D are sagittal sections. A,B: Moderate to weak immunoreactivity spans across area IN, although somata and dendrites are readily visible and defined. In area IN, somata generally have a smaller stature than the more dorsal auditory regions. C,D: Layer V of area T is the most reactive layer. Traces of reactivity can be identified in layer III, but layers II and VI are barren. The arrow points to a layer V pyramidal cell in area T. Asterisks identify commonly found dendritic fragments strewn throughout area T. Scale bars = 50μm.
3.10.1. IN/AII border
There are three dramatic differences in the SMI-32 profiles between areas IN and AII. First, layer II of IN is not immunoreactive while layer II of AII is moderately reactive (compare Figs. 7A and 9A). Secondly, in area IN, the immunoreactive layer V pyramidal cells are not as intensely stained as in AII (compare Figs. 8C and 12A). Lastly, for all cortical layers, the overall somata immunoreactivity is significantly lower in area IN compared to AII (Fig. 10C). The border between IN and AII is classified as “clear-cut.”
3.11. Temporal cortex (T)
Area T is located on the posterior sylvian gyrus (Fig. 2D). Area T has an overall weak immunoreactivity for the SMI-32 antibody and is only reactive for two layers. Layer III is weakly reactive and layer V is moderately reactive (Fig. 12C, arrow; D, sagittal). The average number of labeled somata across layer III per 500μm swathe (15.6±3.3; Table 1) is significantly lower (p<0.05) than the average number of labeled cells across layer III of all auditory areas, (34.5±6.7; Table 1). Apical dendrites are typically not visualized and cell bodies are small (<25μm; Fig. 12C). Basal dendrites are labeled, but they are weakly immunoreactive and often truncated in appearance (Fig. 12C,D). Well-labeled and defined apical dendrites are rarely observed (Fig. 12C,D). However, apical dendrites are commonly observed and have a fragmented appearance (Fig. 12C,D, asterisks).
3.11.1. T/AII border
The absence of labeling of layers II and VI in area T is easy to identify and distinguishes area T from the densely labeled AII. The T/AII border is one of few areal borders of auditory cortex in which each layer compared is of different intensity and every somata and dendritic count examined is significantly different (Table 1). Somata immunoreactivity in AII is significantly higher in layers II, III, V, and VI when compared to T (Fig. 10D). The border between T and AII is clear-cut.
3.11.2. T/VAF Border
The posterior border of temporal cortex is VAF. As previously described, the profile of VAF at its most ventral extent has a weak SMI-32 staining intensity. Both T and VAF have weak immunoreactivity at their border. Barren layers II and VI of area T help define the T/VAF border. We classify the border as transitional.
3.11.3. T/IN Border
Differences in SMI-32 immunoreactivity place the border between area T and area IN at the fundus of the sylvian sulcus. Faintly labeled and scattered immunoreactive pyramidal cells and fragments of dendritic fields can be identified in layer VI of area IN. No such reactivity is present in layer VI of area T. Another profile characteristic that changes gradually at the border is apical dendrite detail. Apical dendrites within layer V of area IN are often observed and bifurcations are seen among labeled apical dendrites of area IN (Fig. 12A,B). However, well labeled apical dendrites are rarely observed in area T (Fig. 12C,D). There is no abrupt change in profiles at the T/IN border. Therefore, the border is defined as transitional.
3.12. Auditory field of the anterior ectosylvian sulcus (fAES)
fAES is located at the most posterodorsal aspect of the AE sulcus. Sulcal and gyral patterns of the AE sulcus vary greatly from one case to another. The characteristic immunoreactivity of layer III and V somata and dendrites is prevalent in fAES (Fig. 13). Moderate immunoreactivity of somata and dendrites defines layers II, III and V of fAES; while layer VI is best described as reacting lightly to the SMI-32 antibody. Apical dendrites of layer V somata are more commonly observed on the medial aspect of fAES (Fig. 13B, asterisk), whereas the apical dendrites of layer V somata on the lateral aspect of fAES are not usually reactive (Fig. 13C, asterisk). Under lower magnification the lack of apical dendritic reactivity on the lateral aspect is still apparent (Fig. 13A). Sagittal views of AE sulcus reveal a general “widening” of SMI-32 immunoreactivity across the supragranular layers in the anterodorsal plane, but not in the posteroventral plane (Fig. 13D).
Figure 13.
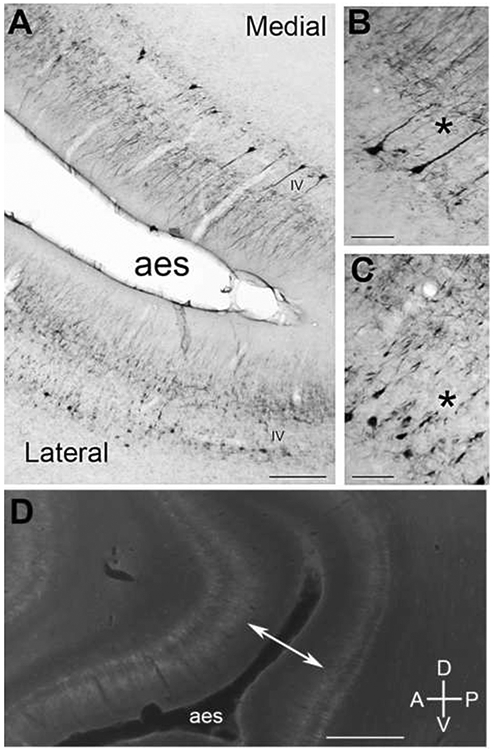
SMI-32 expression in the anterior ectosylvian (AE) sulcus. A: The photomicrograph shows possible SMI-32 subregions within the AE sulcus, medial and lateral. B: At higher power, a characteristic of the medial portion of the AE sulcus is the more full and reactive apical dendrites (*). C: The lateral portion of the AE sulcus has a more fragmented SMI-32 reactivity throughout layer V somata. D: Expression profile of the AE sulcus from another brain prepared sagittally. The double-headed arrow points to reactive disparity evident between supragranular layers of the anterior and posterior regions of the AE sulcus. Scale bars: A = 1000μm; B&C = 50μm; D = 2000μm.
3.12.1. fAES/AI, AAF and AII borders
Borders that include fAES are defined as indefinite. The conformational changes of AE sulcus between individual cases make it difficult to discern a true border in any single tissue plane. AI, AAF and AII all have moderate intensities of the SMI-32 antibody across layer VI, while fAES does not (compare Figs. 3A, 4A, 8A, 13A). Analysis of fAES reveals a significantly low average number of labeled somata in layer VI (15.9±3.8) per 500μm swathe, as compared to the average number of AI, AAF and AII’s layer VI somata count (34.8±4.8) per 500μm swathe (Table 1). Therefore, the only measure that can consistently differentiate fAES from adjacent auditory areas is the severe reduction in SMI-32 immunoreactivity in layer VI.
3.13. Dorsal and ventral immunoreactive properties of cat auditory cortex
The most striking observation of our immunoreactive labeling across auditory cortex is the well-illustrated difference between cortical areas that are more dorsal in the cat cerebrum (AAF, AI, AII, PAF and DZ) and those that are more ventral (VPAF, VAF, T and IN). The density of immunoreactivity throughout the dorsal regions is substantially more abundant than that of the ventral regions (Figs. 2A, B, C). Increased dendritic, neuropil and somata immunoreactivity are the contributing factors to the observed density increase in the dorsal regions. Dorsally, not only are more dendrites sensitive to the antibody, but the average length of immunoreactive dendrites is also increased.
The one “common thread” among all the auditory cortical areas we identified is the layer V immunoreactivity. Since this characteristic is consistent among all areas, it is the somata and dendrites throughout layer V that we used as another division between “dorsal” and “ventral”. In each of the dorsal cortical areas (AI, AAF, AII, DZ and PAF) the average number of cells labeled is >35/500μm swathe, while average somata count among the ventral areas (VAF, T, IN, and VPAF) is <35 (Table 1).
3.14. Functional and anatomical comparison of the AI/AAF border
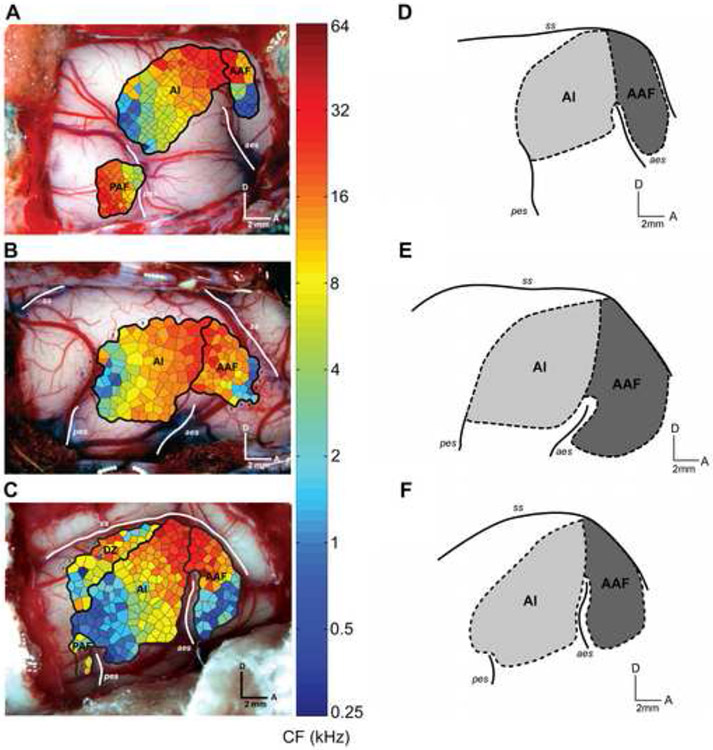
The final portion of the investigation was to determine the relationship between functionally- and anatomically-defined borders in auditory cortex. To do this, we examined the border between A1 and AAF. Consistent with previous reports, both fields were tonotopically organized (Knight, 1977; Merzenich et al., 1975; Reale and Imig, 1980). In all three animals examined, a reversal in the direction of the frequency gradient was observed at the anterior border of A1 (Fig. 14A-C). The border between A1 and AAF was located dorsal to the anterior ectosylvian sulcus at the region of high frequency representation in A1 and AAF (Fig. 14A-C). Similarly, the location of the A1-AAF border, as defined by SMI-32 immunoreactivity (Fig 14 D-F), was identified to be in virtually the identical position as the tonotopically-defined border (eg. compare Fig. 14B and E). This was consistent for all three cases examined (Fig. 14). Therefore, there is a close correlation between the functionally-defined position of an areal border in auditory cortex and the anatomically-defined border differentiated using SMI-32 immunoreactivity.
Figure 14.
The right hemisphere of three brains showing the A1-AAF border as defined by tonotopy (A-C) and the A1-AAF border as defined by SMI-32 reactivity (D-F). A-C) Characteristic frequency representation of two auditory cortical fields. Border was defined based on tonotopic organization. Each polygon represents an estimation of the cortical area with similar response properties as the recording site. The color of each polygon identifies the characteristic frequency at the recorded cortical location. D-F) Location of the A1-AAF border as defined by SMI-32 staining. A1 is shown in light grey and AAF is shown in dark gray. Note the similarities in the position of the border as defined by each method. Sulci are highlighted with thick white lines and indicated by italics: pes, posterior ectosylvian sulcus; ss, suprasylvian sulcus; aes, anterior ectosylvian sulcus. D, dorsal; A, anterior. Scale: 2 mm.
4. Discussion
4.1. Summary
Non-phosphorylated epitopes are found throughout the central nervous system and are identified with the SMI-32 antibody. We have shown that SMI-32 expression is an excellent tool that can be used to distinguish the auditory areas of the cat cerebrum. Each of the examined ten auditory cortical areas has a unique SMI-32 staining signature (Fig. 15). Common features of all auditory cortical areas are: 1) layers I and IV neurons are immunonegative; 2) nearly all immunoreactive cells are pyramidal; and 3) immunoreactive neurons are always present in layer V (Fig. 15).
Figure 15.
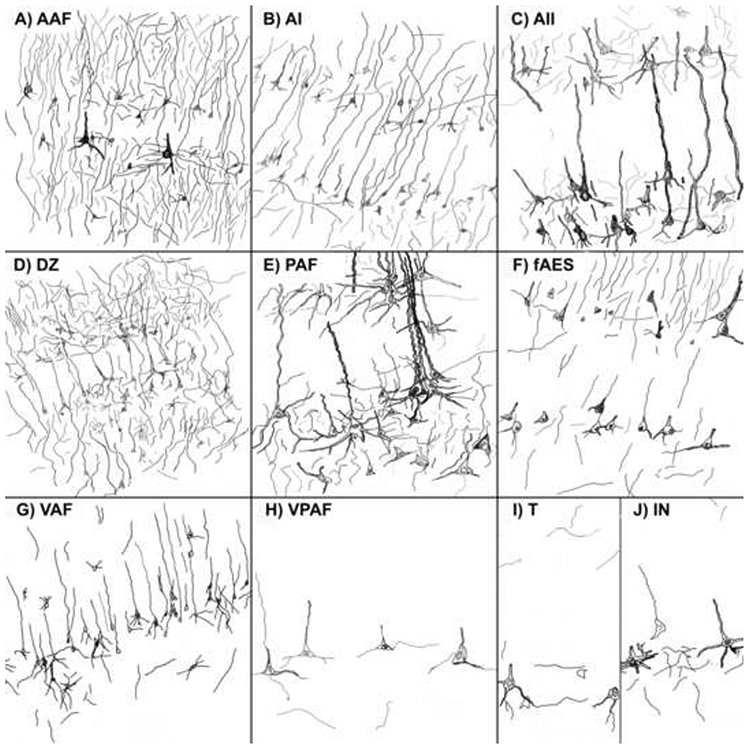
Illustrations of each cortical area examined for SMI-32 immunoreactivity spanning through layers III-V. A: AAF at x200 magnification. Intense immunoreactivity is common throughout AAF. B: AI at x200 magnification. A moderate and even reactivity in layers III and V is a key feature of AI. C: AII at x400 magnification. AII is readily identified by the robust, well-defined and intense labeling of its layer V pyramidal cells. D: DZ at x200 magnification. Similar to AAF, DZ is characterized by its heavily reactive supragranular layers. E: PAF at x600 magnification. Moderate reactivity with patches of larger well labeled layer V somata is characteristic of PAF. F: fAES at x600. fAES displayed moderate reactivity among layers III and V and the size of cells and intensity appear to vary as the sulcus’ conformation changes. G: VAF at x200 magnification. While VAF’s expression profile doesn't particularly stand out, its moderate neuropil immunostaining in layer V is striking enough to discern the region when compared to ventral neighbors VPAF and T. H: VPAF at x600 magnification. Barren supragranular layers and sparsely reactive layer V identify this area as the least immunoreactive of the ten examined regions. I: T at x600 magnification. This ventral region is lightly-moderately labeled with little intensity. Also, smaller cell diameters are more prevalent in T than the dorsal regions. J: IN at x600 magnification. The ventral region IN displayed a light to moderate label with smaller cell bodies that were reactive in layer V.
4.2. SMI-32 antibody as a marker for cat auditory cortex
The current study is a qualitative and quantitative report demonstrating the reliability of the SMI-32 antibody when applied to auditory cortex of the cat. The present study demonstrates the usefulness and feasibility of using SMI-32 staining to delineate areas of the cat auditory cortex in a manner similar to that previously described for the twenty visual areas of the cat cerebrum (Van der Gucht et al., 2001). The application of the SMI-32 antibody selectively marked and uniquely identified ten auditory cortical areas. The present study emphasizes the two primary features of SMI-32 staining in the cerebrum; cell type and laminar position. SMI-32 preferentially labels pyramidal cells and their dendrites in all layers, and large pyramidal cells are more strongly immunoreactive than smaller cells. SMI-32 immunoreactivity targets neurofilament proteins that are found in considerable quantities throughout the neuronal cytoskeleton. The proteins are typically comprised of three subunits with molecular weights of 200, 170 and 70kDa (Liem et al., 1978). Sternberger and Sternberger (1983) showed that heavy (200 kDa) and medium (168 kDa) molecular weight subunits of neurofilament proteins found on dendrites and somata are not phosphorylated, unlike the subunits found in axons, which are phosphorylated. These properties, as defined by Sternberger and Sternberger (1983), permitted us to show that each cortical area has a distinct neurofilament profile and that the changes in SMI-32 profiles between areas indicate an actual difference in function.
In cat auditory cortex SMI-32 preferentially labeled layers III and V. Medium-size layer III pyramidal cells in primary auditory cortex are typically corticocortical projection neurons (Winer, 1984) while the medium sized layer V pyramidal cells target subcortical nuclei (Winer, 1992; Winer and Prieto 2001). The larger, more intensely stained layer V pyramidal cells most likely project to the inferior colliculus (Winer, 1992). This association between immunopositive SMI-32 cells and their efferent targets strengthens the notion that there is a relation between SMI-32 immunoreactivity within a particular layer and the functional role of a given neuronal population.
4.3. Parcellation of cat auditory cortex
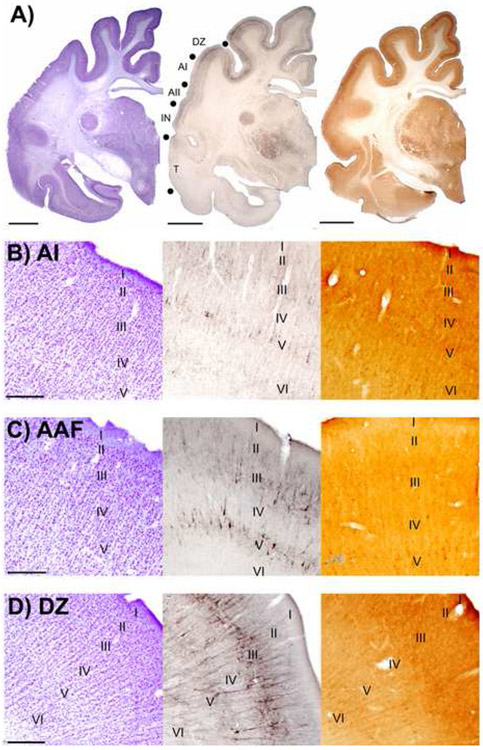
The mammalian auditory cortex contains many functionally distinct areas (see Winer, 1992; Ribaupierre, 1997). Earlier studies have differentiated auditory cortical areas with connectional, functional, physiological, behavioral, pharmacological and metabolic approaches. Establishing architectonic criteria is vital in determining the accuracy of electrode placements, tracer injections, or deactivation loci. Common histological stains such as Nissl, cytochrome oxidase and myelin, have advantages, but are limited when it comes to establishing areal differences and borders (Fig. 16). By using the properties of non-phosphorylated epitopes found throughout cortical (Campbell and Morrison, 1989; Hof et al., 1995b; Nimchinsky et al., 1996; Van der Gucht et al., 2001; Boire et al., 2005) and subcortical (Bickford et al., 1998; Van der Gucht et al., 2001; Boire et al., 2005) structures, SMI-32 has proven to be a very powerful tool for determining functional borders.
Figure 16.
Areal comparisons of sections reacted for the presence of Nissl bodies, SMI-32 reactivity, and cytochrome oxidase (CO) reactivity in auditory cortex. A: Left hemisphere macroscopic views of adjacent coronal sections reacted for Nissl, SMI-32, and CO, respectively. Representative auditory areas are labeled on the middle panel. Borders between areas are indicated with filled black circles. Scale bars = 1cm. B: Adjacent coronal sections through AI reacted for Nissl, SMI-32, and CO, respectively. Photomicrographs were taken at x40 and applies to B, C, and D. Scale bar = 500μm and applies to B, C, and D. C: Adjacent coronal sections through AAF reacted for Nissl, SMI-32, and CO, respectively. D: Adjacent coronal sections through DZ reacted for Nissl, SMI-32, and CO, respectively.
In the present study we utilized additional resources to assist in determining the exact location of each auditory area and the anatomical boundaries between auditory areas. The cortical maps of other investigators and areal descriptions, as well as Nissl-, myelin-, and CO-stained sections were used for guidance in distinguishing cortical laminae. Collectively, these additional resources provided essential information for us to outline the auditory areas of the cat cerebrum and establish areal boundaries. We were able to identify ten auditory areas using the morphological and functional features of neurofilament protein-immunopositive neurons. In general, the present SMI-32 results fit well with currently available data from several mapping studies of cat auditory areas. We found a nearly exact correlation between the location of these ten auditory areas as determined by SMI-32 immunocytochemistry and those determined by previous experiments.
There are four regions of tonotopically-organized auditory cortex in the cat: the primary auditory cortex (AI), the posterior auditory field (PAF), the anterior auditory field (AAF), and the ventral posterior auditory field (VPAF) (Imig et al., 1982). AI is the most extensively studied region in cat auditory cortex. AI is found on the central region of the middle ectosylvian gyrus between the dorsal tips of the anterior and posterior ectosylvian sulci, generally between Horsley-Clarke (1908) coronal levels A1 to A12. AI can be functionally segregated from flanking cortices on the basis of tonotopic mapping (Reale and Imig, 1980). Cytoarchitectonically, the lamination of AI is well described and some attempts have been made to discern the anatomical borders of the area (Rose, 1949; Sousa-Pinto, 1973; Kelly and Wong, 1981). The anatomical borders of AI defined with SMI-32 are in agreement with the tonotopically-defined area AI (Fig. 14; Reale and Imig, 1980).
Anterior to AI is AAF, previously identified as area A, which was originally defined based on its tonotopic representation (Knight, 1977; Reale and Imig, 1980; Phillips and Irvine, 1982). AAF is located along the crown of the anterior suprasylvian gyrus generally between Horsley-Clarke (1908) coronal levels A12 and A18. AAF richly reacts for SMI-32 and the borders were readily distinguishable. The SMI-32-defined borders closely matched those defined by electrophysiological mapping (Fig. 14).
Posterior to AI, on the posterior ectosylvian gyrus, anatomical and electrophysiological investigations suggest that the gyrus contains three parallel and vertically-oriented “belts” (Woolsey, 1960; Reale and Imig, 1980; Updyke, 1986; Bowman and Olson, 1988a,b). The anterior belt contains the two tonotopically organized regions, PAF and VPAF. The middle belt is unimodal and responds to acoustic stimuli, but lacks a tonotopic organization (Bowman and Olson, 1988a,b). This middle belt has been further subdivided into dorsal (dPE), intermediate (iPE), and ventral (vPE) subdivisions based on cytoarchitecture and patterns of extrinsic connections (Winer, 1992). In the present study we did not tackle defining borders for the middle belt areas on the basis of SMI-32 immunoreactivity. The posterior belt, along the entrance to the posterior suprasylvian sulcus, contains both visually- and acoustically-responsive neurons (Updyke, 1986; Bowman and Olson, 1988a,b). In our study, we were able to subdivide the anterior belt into dorsal (PAF) and ventral (VPAF) halves. Area PAF, or area P, as defined by Imig et al. (1982) and Phillips and Orman (1984), is a region that includes the anterior-dorsal posterior ectosylvian gyrus, just caudal to the posterior ectosylvian sulcus and the posterior bank of the posterior ectosylvian sulcus. In this region, the anterior bank of the posterior ectosylvian sulcus contains either AI dorsally, or AII ventrally. SMI-32 identified the borders of PAF and confirmed the anterior border of PAF to be the fundus of the posterior ectosylvian sulcus. VPAF, originally designated area VP, is the ventral extension of PAF and also contains a tonotopic map (Imig et al., 1982). VPAF is found on a region of the anterior-ventral posterior ectosylvian gyrus, just caudal to the posterior ectosylvian gyrus. VPAF extends down the posterior bank of the posterior ectosylvian sulcus to the fundus. This anterior border of VPAF was confirmed in the present study utilizing SMI-32.
We examined six regions of non-tonotopically-organized auditory cortex: the dorsal zone (DZ) of auditory cortex, the auditory field of the anterior ectosylvian sulcus (fAES), the second auditory cortex (AII), the insular (IN) region, the temporal (T) region, and the ventral auditory field (VAF). DZ was originally described by Middlebrooks and Zook (1983) and occupies a region dorsal to AI on the medial edge of the middle ectosylvian gyrus along the lateral lip of the middle suprasylvian sulcus. Most, if not all, of DZ was previously described as a portion of the "suprasylvian fringe" (Woolsey, 1960; Paula-Barbosa et al., 1975; Niimi and Matsuoka, 1979; Beneyto et al., 1998). Using SMI-32, DZ included the dorsal-most portion the lateral bank of the middle suprasylvian sulcus. However, DZ did not include either the anterolateral (ALLS) or posterolateral (PLLS) lateral suprasylvian visual areas (Palmer et al., 1978), which lie just medial to DZ, and have been previously described using SMI-32 (Van der Gucht et al., 2001).
The auditory field contained in the AE sulcus occupies a region at the posterior end of sulcus with the largest portion of the field located on the dorsal bank and fundus (Mucke et al., 1982; Clarey and Irvine, 1986; Meredith and Clemo, 1989). Dorsal to fAES are portions of SIV (Mori et al., 1996), with AII or the anterior sylvian area lying ventrally (Clascá et al., 1997, 2000). The posterior two-thirds of AE sulcus contains both auditory and visual representations (Olson and Graybiel, 1983, 1987; Rauschecker and Korte, 1993).
In addition to the physical uniqueness of the AE sulcus, functionally it is viewed as a multisensory region of cat cortex (Meredith and Clemo, 1989). Multisensory areas are particularly difficult to define with SMI-32 (Van der Gucht et al., 2001). SMI-32 is employed to distinguish differing profiles of what are presumable functionally distinct regions. In regions such as the AE sulcus, those functional “boundaries” are blurred because there are a higher percentage of cells with differing modalities inter-mixed throughout the region (Meredith and Clemo, 1989). Despite varying degrees of difficulty when examining SMI-32 expression profiles there was always at least one characteristic that was not homogenous between the two adjacent areas.
AII is a band of cortex across the middle sylvian gyrus, ventral to AI, between the anterior and posterior ectosylvian sulci (Woolsey, 1960; Reale and Imig, 1980). Using SMI-32, the borders of AII were relatively straight-forward to determine and correlated highly with the borders previously determined by electrophysiological investigations (Woolsey, 1960; Reale and Imig, 1980).
The insular (IN) region occupies a swath of cortex on the anterior sylvian gyrus, between the anterior ectosylvian and sylvian sulci. IN cortex is ventral to AII. Therefore, area IN includes the majority of the anterior sylvian area and the dorsal division of the agranular insular area as defined by Clascá et al. (1997, 2000). Using SMI-32, we defined the temporal (T) area as a band across the posterior sylvian gyrus from the sylvian sulcus, anteriorly, to a position approximately 2mm anterior to the posterior ectosylvian sulcus. Therefore, the temporal area includes area Te of Clascá et al. (2000). The region visible just anterior to the posterior ectosylvian sulcus is the ventral auditory field (VAF; Reale and Imig, 1980). VAF has very low immunoreactivity for SMI-32.
4.4. SMI-32-defined borders within auditory cortex
In the present study, SMI-32 was employed to define the architectonic borders of ten recognized auditory cortical areas in the cat. Along with establishing easily recognizable borders between adjacent cortical areas, each area had a unique profile of SMI-32 labeling. From these results we classified the architectural borders of cat auditory cortex into three basic categories: 1) clear-cut; 2) transitional; and 3) indefinite. Of all the areal borders, four are classified as clear-cut; PAF/VPAF, VAF/VPAF, AII/T, and AII/IN. We defined a border as “clear-cut” when it is distinguishable with the naked eye. There is an obvious and abrupt profile shift from one area to the next and the border can be detected without microscopic investigation. Commonly, the abrupt profile shift is caused by an incongruence of laminar reactivity between two adjacent areas. Transitional borders were defined as a gradual shift in neurofilament profile. Often SMI-32 staining characteristics are similar between adjacent areas. However, there was always a distinct difference in at least one of the profile expression characteristics. The transitional borders included; DZ/AI, AAF/DZ, AAF/AI, AI/PAF, IN/T, T/VAF, VAF/VPAF and PAF/AII. Of the present study’s three border classifications, this group was the most numerous. The last border classification, indefinite, is used to describe borders that include fAES. These borders included fAES/AAF, fAES/AI, and fAES/AII. While fAES is a unimodal field, there are numerous smaller interdigitated sensory fields throughout the sulcus creating pockets of alternating function (Meredith and Clemo, 1989). Assuming a high correlation between function and SMI-32 affinity (Hof et al., 1990; Hof and Morrison, 1990) would help explain why discerning fAES borders proved more difficult to define. While many expression profiles across cases were very similar to each other, fAES is the lone area in which there is a lack of genuine consistency across cases.
4.5. Other modalities and species
Investigations of the mammalian cerebrum utilizing SMI-32 have successfully parsed areas of cortex as a result of labeled nonphosphorylated epitopes on the high- and medium-molecular weight subunits of neurofilament proteins residing in pyramidal cells. These studies have utilized a wide range of species including humans (Campbell and Morrison, 1989; Hof et al., 1992, 1995a; Del Rio and DeFelipe, 1994; Vogt et al., 2001), old-world monkey (Campbell and Morrison, 1989; Hof and Nimchinsky, 1992; Hof and Morrison, 1995; Hof et al., 1995b; Cusick et al., 1995; Nimchinsky et al., 1996; Preuss et al., 1997; Lewis and Van Essen, 2000; Suzuki and Amaral, 2003; Luppino et al., 2005; Saleem et al., 2007), new-world-monkey (Chaudhuri et al., 1996; Duffy and Livingstone, 2003; Baldauf, 2005; Soares et al., 2008), cat (Kaneko et al., 1994; Van der Gucht et al., 2001, 2005), dog (Hof et al., 1996), dolphin (Hof et al., 1992), grey squirrel (Wong and Kaas, 2008), hamster (Boire et al., 2005), echidna (Hassiotis et al., 2004, 2005) and gerbil (Budinger et al., 2000). Across all species examined, large and medium size pyramidal cells are by far the most frequently reactive neuronal types. While some cross-species comparisons can be made in visual cortex (Hof and Morrison, 1990; Hayes and Lewis, 1992; Cusick et al., 1995; Hof et al., 1995b; Nimchinsky et al., 1996; Chaudhuri et al., 1996; Van der Gucht et al., 2001), SMI-32 data concerning auditory cortex of different species is not available, as this is the first comprehensive examination of auditory cortex with SMI-32 in any species. However, as more studies of SMI-32 reactivity in auditory cortex are completed, we may be able to observe shared SMI-32 expression profiles in auditory cortex across many species.
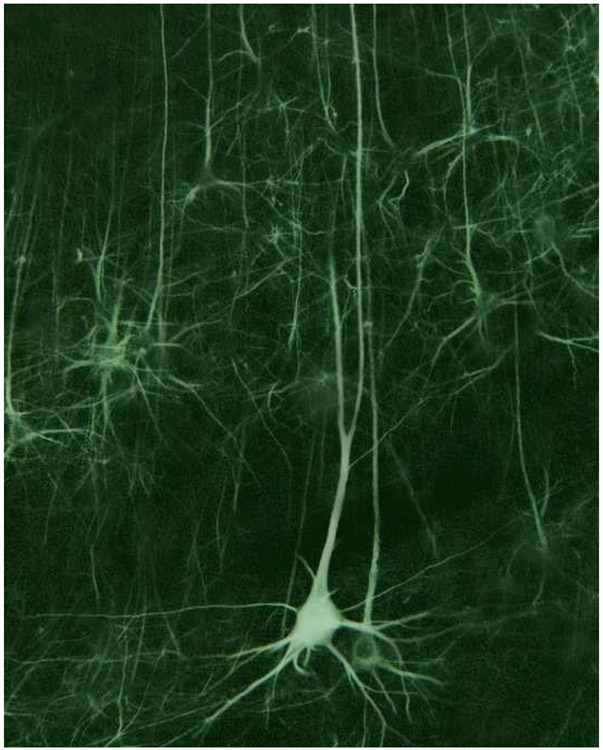
Proposed Cover Illustration.
Darkfield photomicrograph of pyramidal cells immunoreactive for SMI-32 in layers III and V of the posterior auditory field of the cat (magnification =200x).
Acknowledgments
We thank Sang Keun (Sam) Yi for assistance in the histological preparation of tissue and Amee J. Hall with assistance in preparing the manuscript. This work was supported by grants from the Canadian Institutes of Health Research, Natural Sciences and Engineering Research Council of Canada, and the National Institute on Deafness and Other Communication Disorders.
List of Abbreviations:
- A
anterior
- AAF
anterior auditory field
- AE
anterior ectosylvian
- AES
anterior ectosylvian sulcus
- AI
primary auditory cortex
- AII
second auditory cortex
- D
dorsal
- DZ
dorsal zone
- fAES
auditory field of the anterior ectosylvian sulcus
- IN
insular cortex
- P
posterior
- PAF
posterior auditory field
- pes
posterior ectosylvian sulcus
- sss
suprasylvian sulcus
- T
temporal cortex
- V
ventral
- VAF
ventral auditory field
- VPAF
ventral posterior auditory field
Footnotes
Publisher's Disclaimer: This is a PDF file of an unedited manuscript that has been accepted for publication. As a service to our customers we are providing this early version of the manuscript. The manuscript will undergo copyediting, typesetting, and review of the resulting proof before it is published in its final citable form. Please note that during the production process errors may be discovered which could affect the content, and all legal disclaimers that apply to the journal pertain.
References
- Ashwell KWS, Zhang L-L, Marotte LR, 2005. Cyto-and chemoarchitecture of the cortex of the tammar wallaby (macropus eugenii): areal organization. Brain Behav. Evol 66, 114–136. [DOI] [PubMed] [Google Scholar]
- Baldauf ZB, 2005. SMI-32 parcellates the visual cortical areas of the marmoset. Neurosci. Lett 383, 1–2. [DOI] [PubMed] [Google Scholar]
- Beaver BV, Reed W, Leary S, McKiernan B, Bain F, Schultz R, Bennett BT, Pascoe P, Schull E, Cork LC, Francis-Floyd R, Amass KD, Johnson RJ, Schmidt RH, Underwood W, Thorton GW, Kohn B, 2001. 2000 Report of the American Veterinary Medical Association Panel of Euthanasia. J. Am. Vet. Med. Assoc 218, 669–696.11280396 [Google Scholar]
- Beneyto M, Winer JA, Larue DT, Prieto JJ, 1998. Auditory connections and neurochemistry of the sagulum. J. Comp. Neurol 401, 329–351. [PubMed] [Google Scholar]
- Bickford MA, Guido W, Godwin DW, 1998. Neurofilament proteins in Y-cells of the cat lateral geniculate nucleus: normal expression and alteration with visual deprivation. J. Neurosci 18, 6549–6557. [DOI] [PMC free article] [PubMed] [Google Scholar]
- Boire D, Desgent S, Matteau I, Ptito M, 2005. Regional analysis of neurofilament protein immunoreactivity in hamster’s cortex. J. Chem. Neuroanat 29, 193–208. [DOI] [PubMed] [Google Scholar]
- Bowman EM, Olson CR, 1988a. Visual and auditory association areas of the cat’s posterior ectosylvian gyrus: thalamic afferents. J. Comp. Neurol 272, 15–29. [DOI] [PubMed] [Google Scholar]
- Bowman EM, Olson CR, 1988b. Visual and auditory association areas of the cat’s posterior ectosylvian gyrus: cortical afferents. J. Comp. Neurol 272, 30–42. [DOI] [PubMed] [Google Scholar]
- Brodmann K, 1909. Vergleichende Lokalisationslehre der Großhirnrinde (Localization in the Cerebral Cortex). Leipzig J.A. Barth. [Google Scholar]
- Budinger E, Heil P, Scheich H, 2000. Functional organization of auditory cortex in the Mongolian gerbil (Meriones unguiculatus). III. Anatomical subdivisions and corticocortical connections. Eur. J. Neurosci 12, 2425–2452. [DOI] [PubMed] [Google Scholar]
- Carrasco A, Lomber SG 2009a. Differential modulatory influences between primary auditory cortex and the anterior auditory field. J. Neurosci 29, 8350–8362. [DOI] [PMC free article] [PubMed] [Google Scholar]
- Carrasco A, Lomber SG 2009b. Evidence for hierarchical processing in cat auditory cortex: nonreciprocal influence of primary auditory cortex on the posterior auditory field. J. Neurosci 29, 14323–14333. [DOI] [PMC free article] [PubMed] [Google Scholar]
- Campbell MJ, Morrison JH, 1989. Monoclonal antibody to neurofilament protein (SMI-32) labels a subpopulation of pyramidal neurons in the human and monkey neocortex. J. Comp. Neurol 282, 191–205. [DOI] [PubMed] [Google Scholar]
- Chaudhuri A, Zangenehpour S, Matsubara JA, Cynader MS, 1996. Differential expression of neurofilament protein in the visual system of the vervet monkey. Brain Res. 709, 17–26. [DOI] [PubMed] [Google Scholar]
- Cheung SW, Nagarajan SS, Bedenbaugh PH, Schreiner CE, Wang X, Wong A, 2001. Auditory cortical neuron response differences under isoflurane versus pentobarbital anesthesia. Hear. Res 156, 115–127. [DOI] [PubMed] [Google Scholar]
- Clarey JC, Irvine DRF, 1986. Auditory response properties of neurons in the anterior ectosylvian sulcus of the cat. Brain Res. 386, 12–19. [DOI] [PubMed] [Google Scholar]
- Clascá F, Llamas A, Reinoso-Suárez F, 1997. Insular cortex and neighboring fields in the cat: a redefinition based on cortical microarchitecture and connections with the thalamus. J. Comp. Neurol 384, 456–482. [DOI] [PubMed] [Google Scholar]
- Clascá F, Llamas A, Reinoso-Suárez F, 2000. Cortical connections of the insular and adjacent parieto-temporal fields in the cat. Cereb. Cortex 4, 371–399. [DOI] [PubMed] [Google Scholar]
- Cusick CG, Seltzer B, Cola M, Griggs E, 1995. Chemoarchitectonics and corticocortical terminations within the superior temporal sulcus of the rhesus monkey: evidence for subdivisions of superior temporal polysensory cortex. J. Comp. Neurol 360, 513–535. [DOI] [PubMed] [Google Scholar]
- Del Rio MR, DeFelipe J, 1994. A study of SMI 32-stained pyramidal cells, parvalbumin-immunoreactive chandelier cells, and presumptive thalamocortical axons in the human temporal neocortex. J. Comp. Neurol 342, 389–408. [DOI] [PubMed] [Google Scholar]
- Duffy KR, Livingstone MS, 2003. Distribution of non-phosphorylated neurofilament in squirrel monkey V1 is complementary to the pattern of cytochrome-oxidase blobs. Cereb Cortex. 13, 722–727. [DOI] [PMC free article] [PubMed] [Google Scholar]
- Fuentes-Santamaria V, Stein BE, McHaffie JG, 2006. Neurofilament proteins are preferentially expressed in descending output neurons of the cat the superior colliculus: a study using SMI-32. Neuroscience 138, 55–68. [DOI] [PubMed] [Google Scholar]
- Hassiotis M, Paxinos G, Ashwell KW, 2004. Cyto- and chemoarchitecture of the cerebral cortex of the Australian echidna (Tachyglossus aculeatus). I. Areal organization. J. Comp. Neurol 475, 493–517. [DOI] [PubMed] [Google Scholar]
- Hassiotis M, Paxinos G, Ashwell KW, 2005. Cyto- and chemoarchitecture of the cerebral cortex of an echidna (Tachyglossus aculeatus). II. Laminar organization and synaptic density. J. Comp. Neurol 482, 94–122. [DOI] [PubMed] [Google Scholar]
- Hayes TL, Lewis DA, 1992. Nonphosphorylated neurofilament protein and calbindin immunoreactivity in layer III pyramidal neurons of human neocortex. Cereb Cortex 2, 56–67. [DOI] [PubMed] [Google Scholar]
- Hof PR, Morrison JH, 1990. Quantitative analysis of a vulnerable subset of pyramidal neurons in Alzheimer's disease: II. Primary and secondary visual cortex. J. Comp. Neurol 301, 55–64. [DOI] [PubMed] [Google Scholar]
- Hof PR, Morrison JH, 1995. Neurofilament protein defines regional patterns of cortical organization in the macaque monkey visual system: a quantitative immunohistochemical analysis. J. Comp. Neurol 352, 161–186. [DOI] [PubMed] [Google Scholar]
- Hof PR, Cox K, Morrison JH, 1990. Quantitative analysis of a vulnerable subset of pyramidal neurons in Alzheimer's disease: I. Superior frontal and inferior temporal cortex. J. Comp. Neurol 301, 44–54. [DOI] [PubMed] [Google Scholar]
- Hof PR, Glezer II, Archin N, Janssen WG, Morgane PJ, Morrison JH, 1992. The primary auditory cortex in cetacean and human brain: a comparative analysis of neurofilament protein-containing pyramidal neurons. Neurosci. Lett 146, 91–95. [DOI] [PubMed] [Google Scholar]
- Hof PR, Nimchinsky EA, 1992. Regional distribution of neurofilament and calcium-binding proteins in the cingulate cortex of the macaque monkey. Cereb. Cortex 2, 456–467. [DOI] [PubMed] [Google Scholar]
- Hof PR, Mufson EJ, Morrison JH, 1995a. Human orbitofrontal cortex: cytoarchitecture and quantitative immunohistochemical parcellation. J. Comp. Neurol 359, 48–68. [DOI] [PubMed] [Google Scholar]
- Hof PR, Nimchinsky EA, Morrison JH, 1995b. Neurochemical phenotype of corticocortical connections in the macaque monkey: quantitative analysis of a subset of neurofilament protein-immunoreactive projection neurons in frontal, parietal, temporal, and cingulate cortices. J. Comp. Neurol 362, 109–133. [DOI] [PubMed] [Google Scholar]
- Hof PR, Bogaert YE, Rosenthal RE, Fiskum G 1996. Distribution of neuronal populations containing neurofilament protein and calcium-binding proteins in the canine neocortex: regional analysis and cell typology. J. Chem. Neuroanat 11, 81–98. [DOI] [PubMed] [Google Scholar]
- Horsley V, Clarke RH, 1908. The structure and function of the cerebellum examined by a new method. Brain 31, 45–124. [Google Scholar]
- Huang CL, Winer JA, 2000. Auditory thalamocortical projections in the cat: laminar and areal patterns of input. J. Comp. Neurol 427, 302–331. [DOI] [PubMed] [Google Scholar]
- Imaizumi K, Priebe NJ, Crum PA, Bedenbaugh PH, Cheung SW, Schreiner CE, 2004. Modular functional organization of cat anterior auditory field. J. Neurophysiol 92, 444–457. [DOI] [PubMed] [Google Scholar]
- Imig TJ, Reale RA, 1980. Patterns of cortico-cortical connections related to tonotopic maps in cat auditory cortex. J. Comp. Neurol 192, 292–332. [DOI] [PubMed] [Google Scholar]
- Imig TJ, Morel A, 1983. Organization of the thalamocortical auditory system in the cat. Ann. Rev. Neurosci 6, 95–120. [DOI] [PubMed] [Google Scholar]
- Imig TJ, Reale RA, Brugge JF, 1982. The auditory cortex: patterns of corticocortical projections related to physiological maps in the cat. In: Woolsey CN (Ed.) Cortical Sensory Organization: Vol. 3 Multiple Auditory Areas, Humana Press, Clifton, New Jersey, pp. 1–41. [Google Scholar]
- Jebb AH, Woolsey TA, 1977. A simple stain for myelin in frozen sections: a modification of Mahon’s method. Stain. Tech 52, 315–318. [DOI] [PubMed] [Google Scholar]
- Kaneko T, Caria MA, Asanuma H 1994. Information processing within the motor cortex. II. Intracortical connections between neurons receiving somatosensory cortical input and motor output neurons of the cortex. J. Comp. Neurol 345, 172–184. [DOI] [PubMed] [Google Scholar]
- Kelly JB, Whitfield IC, 1971. Effects of auditory cortical lesions on discriminations of rising and falling frequency-modulated tones. J. Neurophysiol 34, 802–816. [DOI] [PubMed] [Google Scholar]
- Kelly JP, Wong D, 1981. Laminar connections of the cat’s auditory cortex. Brain Res. 212, 1–15. [DOI] [PubMed] [Google Scholar]
- Knight PL, 1977. Representation of the cochlea within the anterior auditory field (AAF) of the cat. Brain Res. 130, 447–467. [DOI] [PubMed] [Google Scholar]
- Lee CC, Winer JA, 2008a. Connections of cat auditory Cortex: I. Thamalocortical system. J. Comp. Neurol 507, 1879–1900. [DOI] [PMC free article] [PubMed] [Google Scholar]
- Lee CC, Winer JA, 2008b. Connections of cat auditory Cortex: II. Commissural system. J. Comp. Neurol 507, 1901–1919. [DOI] [PMC free article] [PubMed] [Google Scholar]
- Lee CC, Winer JA, 2008c. Connections of cat auditory Cortex: III. Corticocortical system. J. Comp. Neurol 507, 1920–1943. [DOI] [PMC free article] [PubMed] [Google Scholar]
- Lewis JW, Van Essen DC, 2000. Mapping of architectonic subdivisions in the macaque monkey, with emphasis on parieto-occipital cortex. J. Comp. Neurol 428, 79–111. [DOI] [PubMed] [Google Scholar]
- Liem RKH, Yen S-H, Salomon GD, Shelanski ML, 1978. Intermediate filaments in nervous tissues. J. Cell. Biol 79, 637–645. [DOI] [PMC free article] [PubMed] [Google Scholar]
- Lomber SG, Malhotra S, 2008. Double dissociation of “what” and “where” processing in auditory cortex. Nat. Neurosci 11, 609–616. [DOI] [PubMed] [Google Scholar]
- Lomber SG, Malhotra S, Hall AJ, 2007. Functional specialization in non-primary auditory cortex of the cat: areal and laminar contributions to sound localization. Hear. Res 229, 31–45. [DOI] [PubMed] [Google Scholar]
- Luppino G, Hamed SB, Gamerini M, Matelli M, Galletti C, 2005. Occipital (V6) and parietal (V6A) areas in the anterior wall of the parieto-occipital sulcus of the macaque: a cytoarchitecture study. Eur. J. Neurosci 21, 3056–3076. [DOI] [PubMed] [Google Scholar]
- Malhotra S, Lomber SG, 2007. Sound localization during homotopic and heterotopic bilateral cooling deactivation of primary and non-primary auditory cortical areas in the cat. J. Neurophysiol 97, 26–43. [DOI] [PubMed] [Google Scholar]
- Malhotra S, Stecker GC, Middlebrooks JC, Lomber SG, 2008. Sound localization deficits during reversible deactivation of primary auditory cortex and/or the dorsal zone. J. Neurophysiol 99, 1628–1642. [DOI] [PubMed] [Google Scholar]
- Mellott JG, Van der Gucht E, Lee CC, Larue DT, Winer JA, Lomber SG, 2005. Distinguishing cat auditory cortex areas with SMI-32. Program No. 282.1. 2005 Abstract Viewer/Itinerary Planner. Washington, DC: Society for Neuroscience. Online. [Google Scholar]
- Meredith MA, Clemo HR, 1989. Auditory cortical projection from the anterior ectosylvian sulcus (field AES) to the superior colliculus in the cat: an anatomical and electrophysiological study. J. Comp. Neurol 289, 687–707. [DOI] [PubMed] [Google Scholar]
- Merzenich MM, Knight PL, Roth GL, 1975. Representation of cochlea within primary auditory cortex in the cat. J. Neurophysiol 38: 231–249. [DOI] [PubMed] [Google Scholar]
- Middlebrooks JC, Zook JM, 1983. Intrinsic organization of the cat’s medial geniculate body identified by projections to binaural response-specific bands in the primary auditory cortex. J Neurosci. 3, 203–224. [DOI] [PMC free article] [PubMed] [Google Scholar]
- Morel A, Imig TJ, 1987. Thalamic projections to fields A, AI, P, and VP in the cat auditory cortex. J. Comp. Neurol 265, 119–144. [DOI] [PubMed] [Google Scholar]
- Mori A, Fuwa T, Kawai A, Yoshimoto T, Hiraba Y, Uchiyama Y, Minejima T, 1996. The ipsilateral and contralateral connections of the fifth somatosensory area (SV) in the cat cerebral cortex. Neuroreport 7, 2385–2387. [DOI] [PubMed] [Google Scholar]
- Mucke L, Norita M, Benedek G, Creutzfeldt O, 1982. Physiologic and anatomic investigation of a visual cortical area situated in the ventral bank of the anterior ectosylvian sulcus of the cat. Exp. Brain Res 46, 1–11. [DOI] [PubMed] [Google Scholar]
- Neff WD, Diamond IT, Casseday JH, 1975. Behavioral studies of auditory discrimination: central nervous system. In: Keidel WD, Neff WD (Eds.), Handbook of Sensory Physiology. Auditory System Vol. V/2. Springer-Verlag, New York, pp. 307–400. [Google Scholar]
- Niimi K, Matsuoka H, 1979. Thalamocortical organization of the auditory system in the cat studied by retrograde and axonal transport of horseradish peroxidase. Adv. Anat. Embryol. Cell Biol 57, 1–56. [DOI] [PubMed] [Google Scholar]
- Nimchinsky EA, Hof PR, Young WG, Morrison JH, 1996. Neurochemical, morphological, and laminar characterization of cortical projection neurons in the cingulate motor areas of the macaque monkey. J. Comp. Neurol 374, 136–160. [DOI] [PubMed] [Google Scholar]
- Olfert ED, Cross BM, McWilliam AA, 1993. Guide to the Care and Use of Experimental Animals. Canadian Council on Animal Care. [Google Scholar]
- Olson CR, Graybiel AM, 1983. An outlying visual area in the cerebral cortex of the cat. Prog. Brain Res 58, 239–245. [DOI] [PubMed] [Google Scholar]
- Olson CR, Graybiel AM, 1987. Ectosylvian visual area of the cat: location, retinotopic organization and connections. J. Comp. Neurol 261, 277–294. [DOI] [PubMed] [Google Scholar]
- Palmer LA, Rosenquist AC, Tusa RJ, 1978. The retinotopic organization of lateral suprasylvian visual areas in the cat. J. Comp. Neurol 177, 237–256. [DOI] [PubMed] [Google Scholar]
- Paula-Barbosa MM, Feyo PB, Sousa-Pinto A, 1975. The association connexions of the suprasylvian fringe (SF) and other areas of the cat auditory cortex. Exp. Brain Res 23, 535–554. [DOI] [PubMed] [Google Scholar]
- Payne BR, Lomber SG, 1996. Age dependent modification of cytochrome oxidase activity in the cat dorsal lateral geniculate nucleus following removal of primary visual cortex. Vis. Neurosci 13, 805–816. [DOI] [PubMed] [Google Scholar]
- Phillips DP, and Irvine DR, 1982. Properties of single neurons in the anterior auditory field (AAF) of cat cerebral cortex. Brain Res. 248, 237–244. [DOI] [PubMed] [Google Scholar]
- Phillips DP, Orman SS, 1984. Responses of single neurons in posterior field of cat auditory cortex to tonal stimulation. J. Neurophysiol 51, 147–163. [DOI] [PubMed] [Google Scholar]
- Preuss TM, Stepniewska I, Jain N, Kaas JH, 1997. Multiple divisions of macaque precentral motor cortex identified with neurofilament antibody SMI-32. Brain Res. 767, 148–153. [DOI] [PubMed] [Google Scholar]
- Rauschecker JP, Korte M, 1993. Auditory compensation for early blindness in cat cerebral cortex. J. Neurosci 13, 4538–4548. [DOI] [PMC free article] [PubMed] [Google Scholar]
- Reale RA, Imig TJ, 1980. Tonotopic organization in auditory cortex of the cat. J. Comp. Neurol 192, 265–291. [DOI] [PubMed] [Google Scholar]
- de. Ribaupierre F, 1997. Acoustical information processing in the auditory thalamus and cerebral cortex. In: Ehret G, Romand R (Eds.), The Central Auditory System, edited by Oxford Univ. Press, New York, pp. 317–397. [Google Scholar]
- Riederer BM, Porchet R, Marugg R, 1996. Differential expression and modification of neurofilament triplet proteins during cat cerebellar development. J. Comp. Neurol 364, 704–717. [DOI] [PubMed] [Google Scholar]
- Rose JE, 1949. The cellular structure of the auditory region of the cat. J. Comp. Neurol 91, 409–440. [DOI] [PubMed] [Google Scholar]
- Rosenquist AC, 1985. Connections of visual cortical areas in the cat. In: Peters A, Jones EG (Eds.), Cerebral Cortex, Vol 3, Visual Cortex, Plenum Press, New York, pp. 81–117. [Google Scholar]
- Saleem KS, Price JL, Hashikawa T, 2007. Cytoarchitectonic and chemoarchitectonic subdivisions of the perirhinal and parahipocampal cortices of macaque monkeys. J. Comp. Neurol 500, 973–1006. [DOI] [PubMed] [Google Scholar]
- Sanides F, Hoffman J, 1969. Cyto-and myelo- architecture of the visual cortex of the cat and of the surrounding integration cortices. J. Hirnforsch 11, 79–104. [PubMed] [Google Scholar]
- Soares JG, Rosado de Castro PH, Fiorani M, Nascimento-Silva S, Gattass R, 2008. Distribution of neurofilament proteins in the lateral geniculate nucleus, primary visual cortex, and area MT of adult Cebus monkeys. J. Comp. Neurol 508, 605–614. [DOI] [PubMed] [Google Scholar]
- Sousa-Pinto A, 1973. The structure of the first auditory cortex (AI) in the cat. I. Light microscope observations on its structure. Arch. Ital. Bio.l 111, 112–137. [PubMed] [Google Scholar]
- Sternberger LA, Sternberger NH, 1983. Monoclonal antibodies distinguish phosphorylated and nonphosphorylated forms of neurofilaments in situ. Proc. Natl. Acad. Sci. USA 80, 6126–6130. [DOI] [PMC free article] [PubMed] [Google Scholar]
- Strominger NL, 1969. Subdivisions of auditory cortex and their role in localization of sound in space. Exp. Neurol 24, 348–362. [DOI] [PubMed] [Google Scholar]
- Suzuki WA, Amaral DG (2003). Perirhinal and parahippocampal cortices of the macaque monkey: cytoarchitectonic and chemoarchitectonic organization. J. Comp. Neurol 463, 67–91. [DOI] [PubMed] [Google Scholar]
- Updyke BV, 1986. Retinotopic organization within the cat’s posterior suprasylvian sulcus and gyrus. J. Comp. Neurol 246, 265–280. [DOI] [PubMed] [Google Scholar]
- Van der Gucht E, Vandesande F, Arckens L, 2001. Neurofilament Protein: A selective marker for the architectonic parcellation of the visual cortex in adult cat brain. J. Comp. Neurol 441, 345–368. [DOI] [PubMed] [Google Scholar]
- Van der Gucht E, Clerens S, Jacobs S, Arckens L, 2005. Light-induced Fos expression in phosphate-activated glutaminase- and neurofilament protein-immunoreactive neurons in cat primary visual cortex. Brain Res. 1035, 60–66. [DOI] [PubMed] [Google Scholar]
- Vogt BA, Vogt LJ, Hof PR, 2001. Cytology of human caudomedial cingulate, retrosplenial, and caudal parahippocampal cortices. J. Comp. Neurol 438, 353–376. [DOI] [PubMed] [Google Scholar]
- Winer JA, 1984. The pyramidal neurons in layer III of cat primary auditory cortex (AI). J. Comp. Neurol 229, 476–496. [DOI] [PubMed] [Google Scholar]
- Winer JA, 1992. The functional architecture of the medial geniculate body and the primary auditory cortex. In: Webster DB, Popper AN, Fay RR (Eds.) The Mammalian Auditory Pathway: Neuroanatomy, Springer-Verlag, New York, pp. 222–409. [Google Scholar]
- Winer JA, Prieto JJ, 2001. Layer V in cat primary auditory cortex (AI): cellular architecture and identification of projection neurons. J. Comp. Neurol 434, 379–412. [DOI] [PubMed] [Google Scholar]
- Wong. P, Kaas JH, 2008. Architectonic subdivisions of neocortex in the grey squirrel (Sciurus carolinensis). Anat. Rec 291, 1301–1333. [DOI] [PMC free article] [PubMed] [Google Scholar]
- Wong P, Kaas JH, 2009. Architectonic subdivisions of neocortex in the tree shrew (Tupaia belangeri). Anat. Rec 292, 994–1027. [DOI] [PMC free article] [PubMed] [Google Scholar]
- Wong-Riley M, 1979. Changes in the visual system of monocularly sutured or enucleated cats demonstrable with cytochrome oxidase histochemistry. Brain Res. 171, 11–28. [DOI] [PubMed] [Google Scholar]
- Woolsey CN, 1960. Organization of cortical auditory system: a review and synthesis. In: Rasmussen GL, Windle WF, (Eds.) Neural Mechanisms of the Auditory and Vestibular Systems. Charles C. Thomas, Springfield, IL. pp. 165–180. [Google Scholar]


