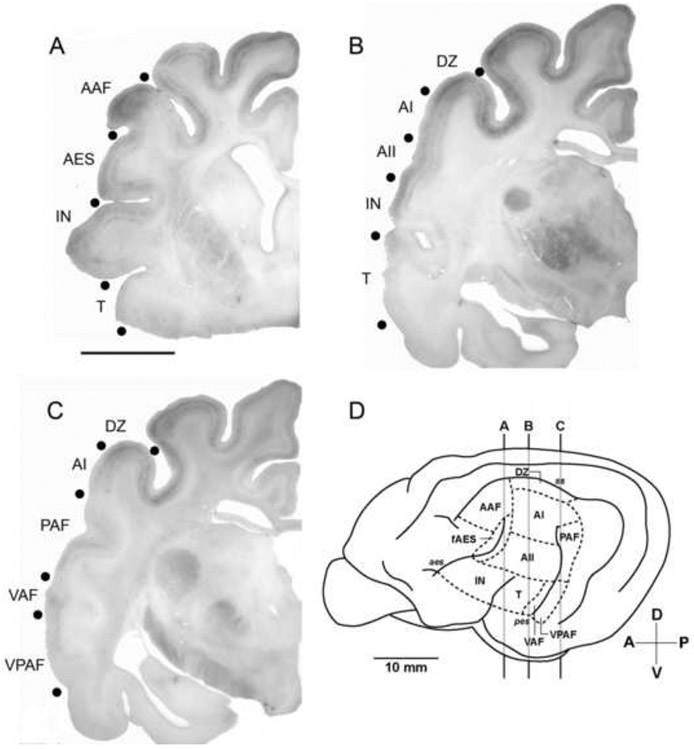
Figure 2.

Macroscopic views of coronal sections showing SMI-32 immunoreactivity. Even at low magnification the areal boundaries between neighboring regions and differing intensities can be identified (filled black circles). A: The anterior-most cortical regions identified (AAF, fAES, IN) and surrounding area (T). Dorsal regions were more heavily reactive, specifically within layer III, than the ventral regions, IN and T. Scale bar = 1cm and applies to A, B, & C. B: Middle ectosylvian regions (AI, AII, T) and neighboring regions (DZ, IN). C: Posterior ectosylvian regions (PAF, VPAF) along with middle ectosylvian VAF and neighboring regions (DZ, AI). D: Lateral view of the left cerebrum identifying the coronal positions of sections A, B and C. For abbreviations, see List.
