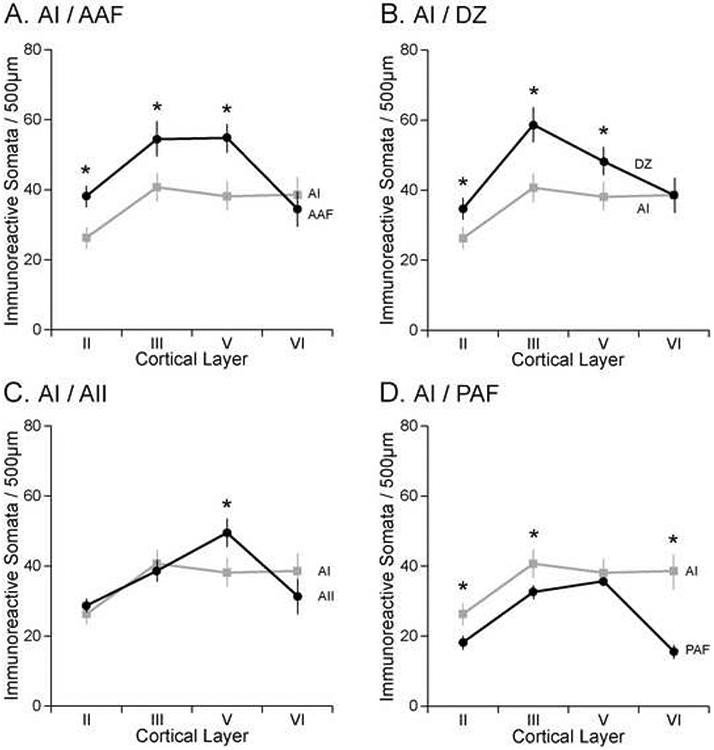
Figure 6.

Comparison of somata immunoreactivity between AI and each of its neighbors. A: AAF, B: DZ, C: AII, D: PAF. Each border shown is transitional. Graphs show mean ± SE immunoreactivity in each of the four immunoreactive layers (II, III, V, VI). Asterisks indicate significant difference at p<0.01.
