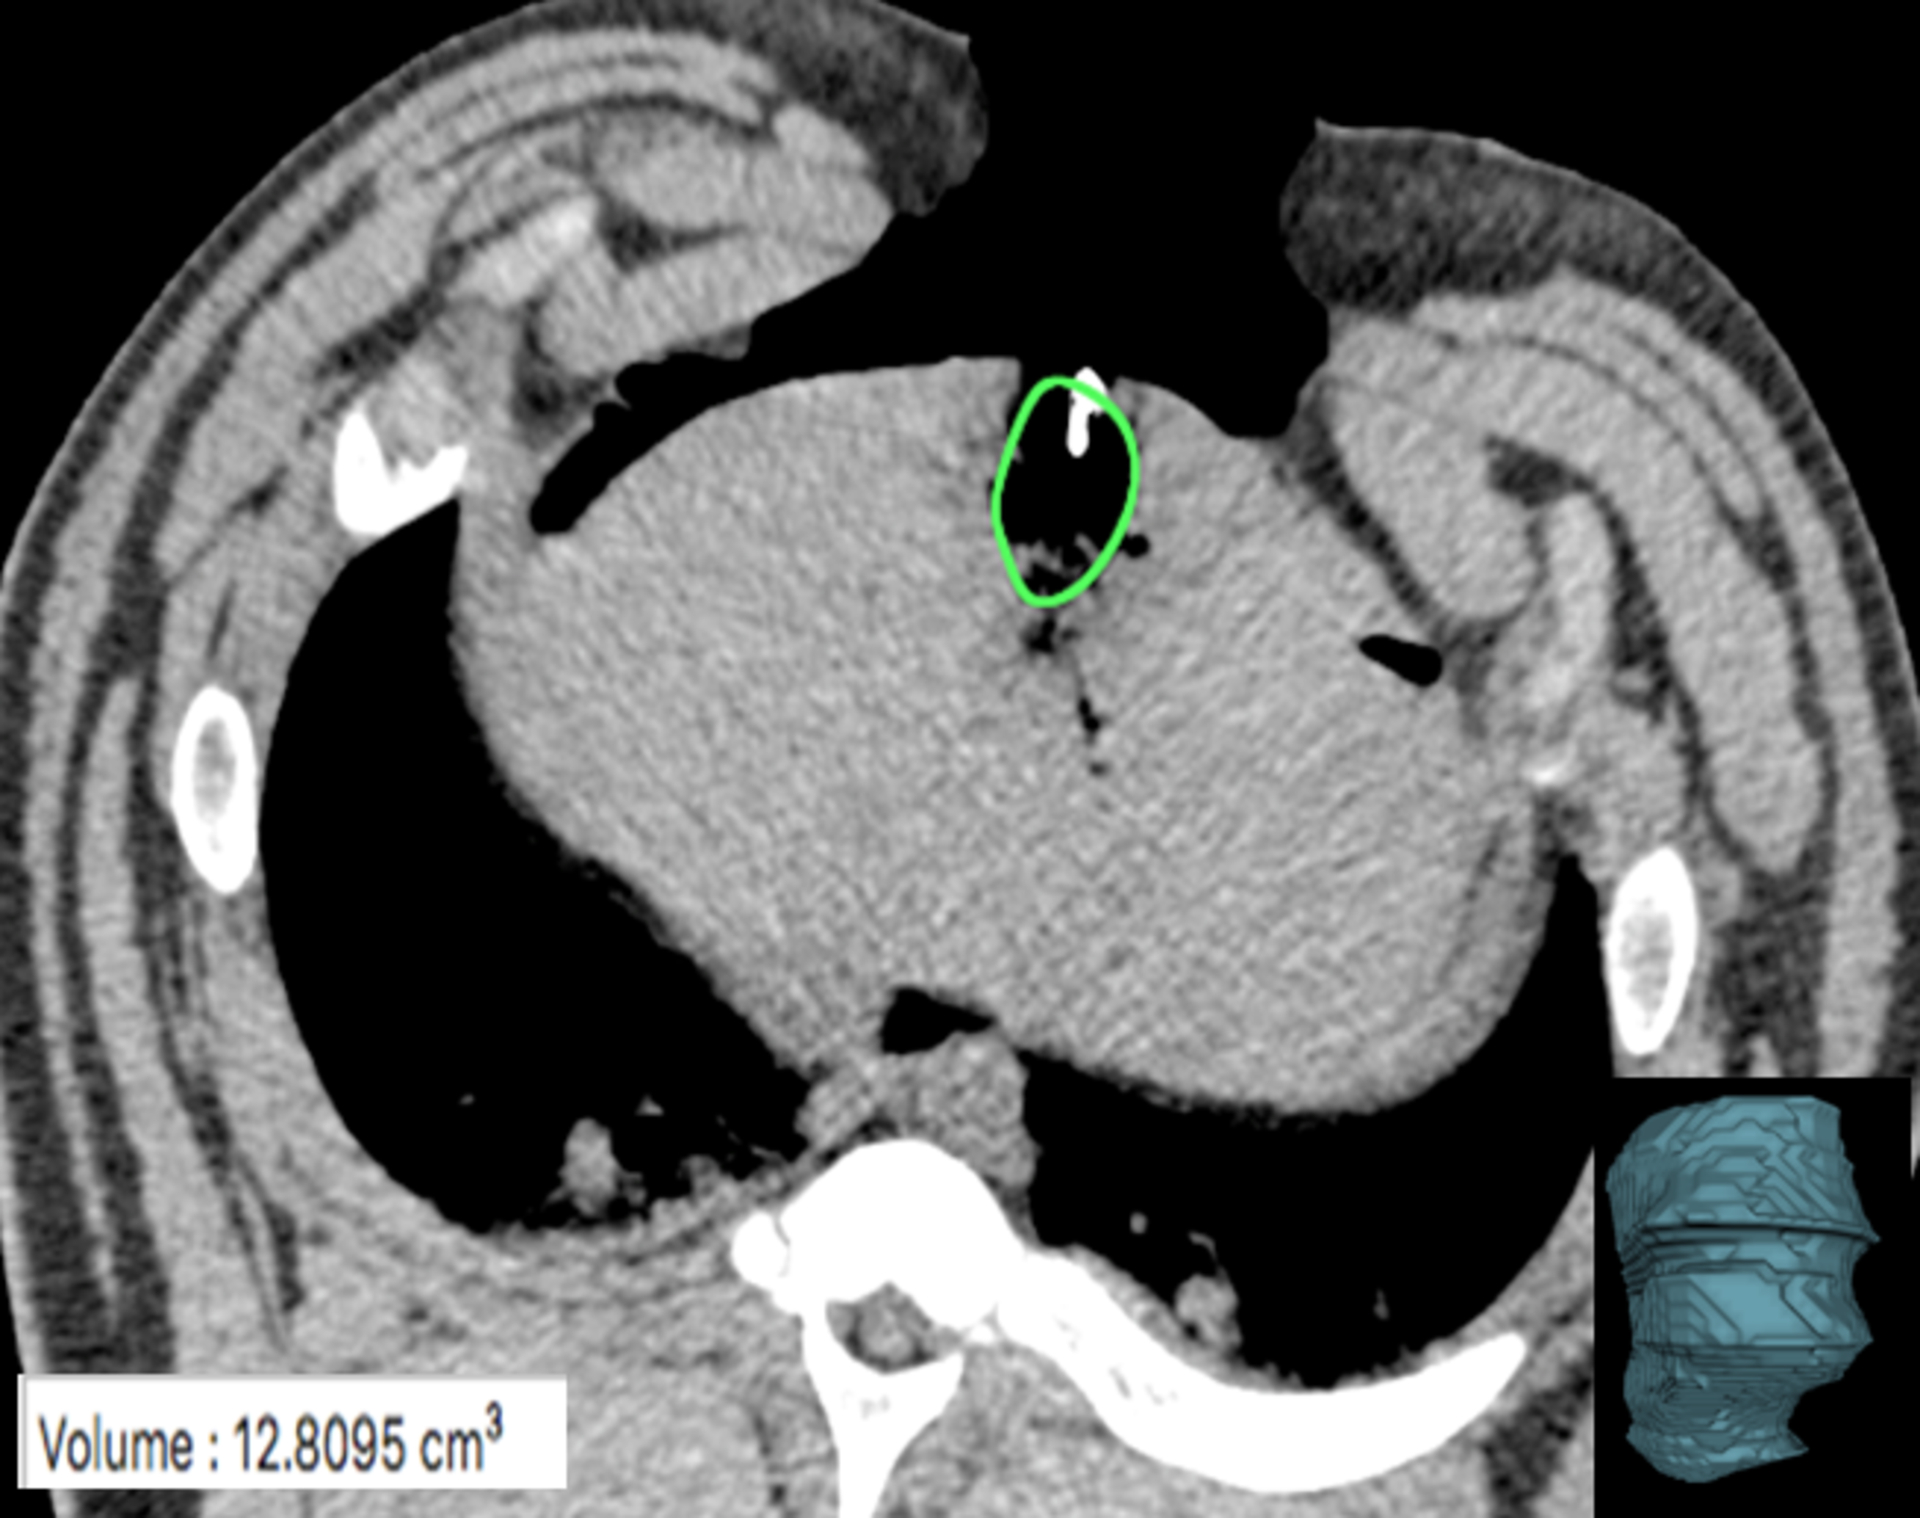
Figure 4:

CT slice with MW gas zone outline (green oval). The gas zone was outlined using semi-automated software and edges confirmed on contiguous axial images to define the volumetric extent of the zone of visible gas. A corresponding volume rendered composite (bottom right image) created and the resultant volume output (bottom left corner) was recorded.
