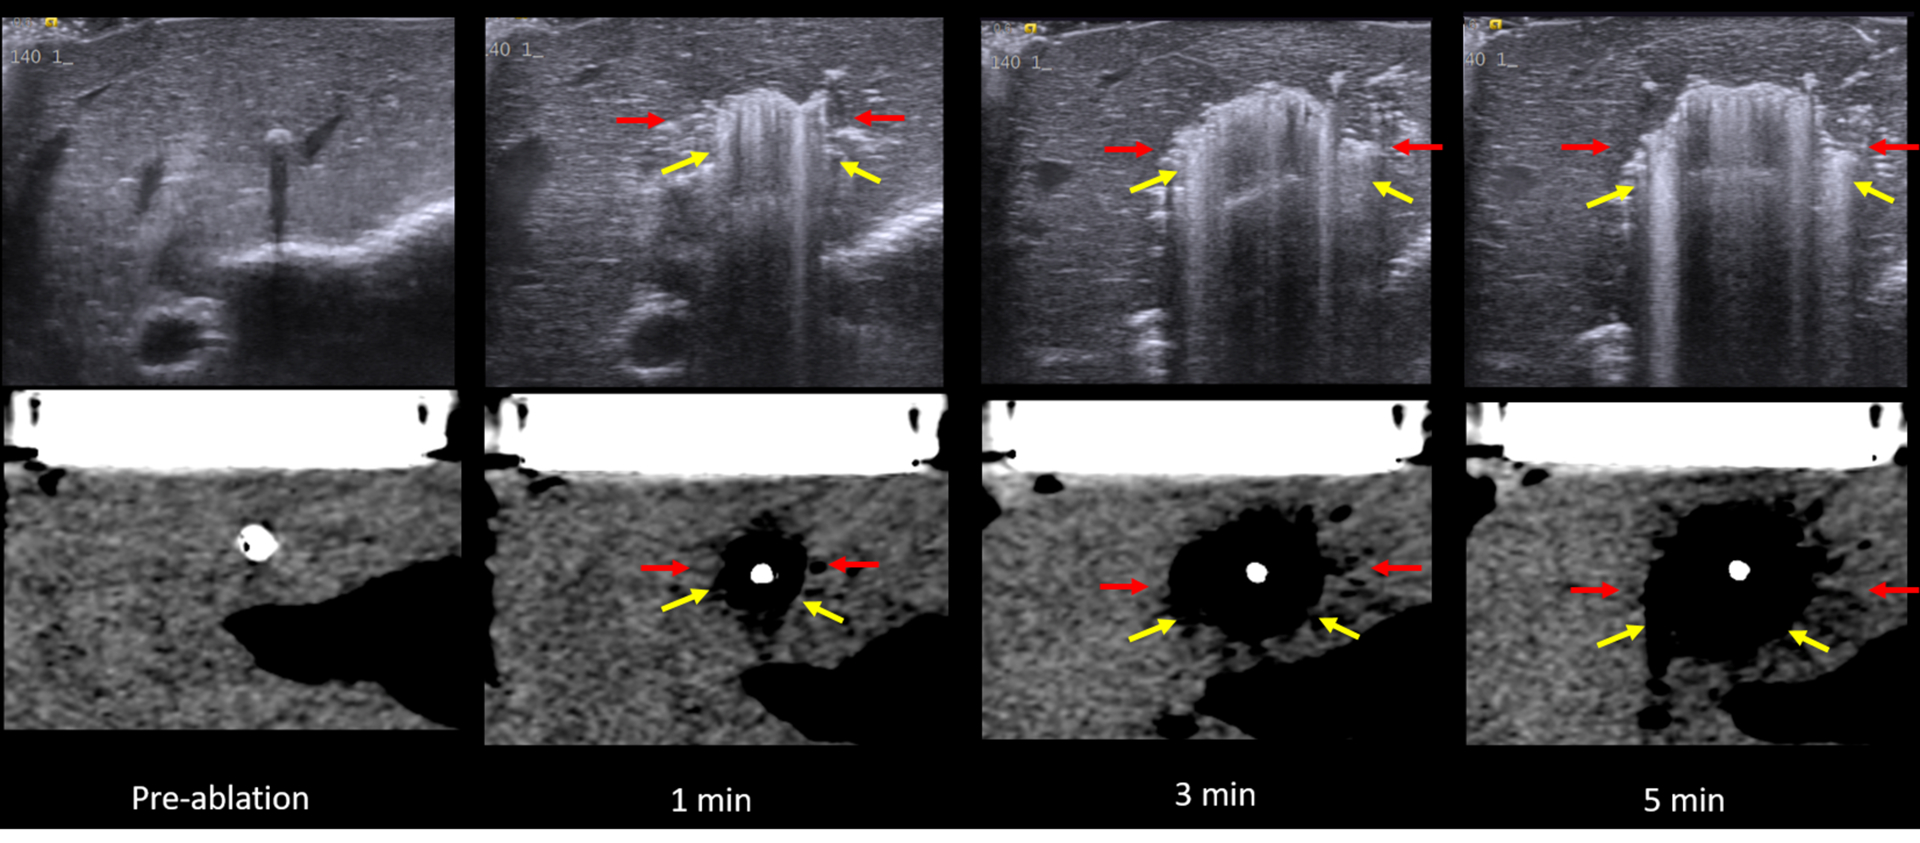
Figure 6:

US (top) vs. CT (bottom) intra-procedure images of MW ablation. Yellow arrows describe the zone of gas while red arrows indicate the hypoechoic/hypodense zone. Note the easy visibility of gas within the ablation zone on both ultrasound and CT while the hypodense zone is subtle, particularly on CT. These images also demonstrate the continually visible growth of the zone of out-gassing.
