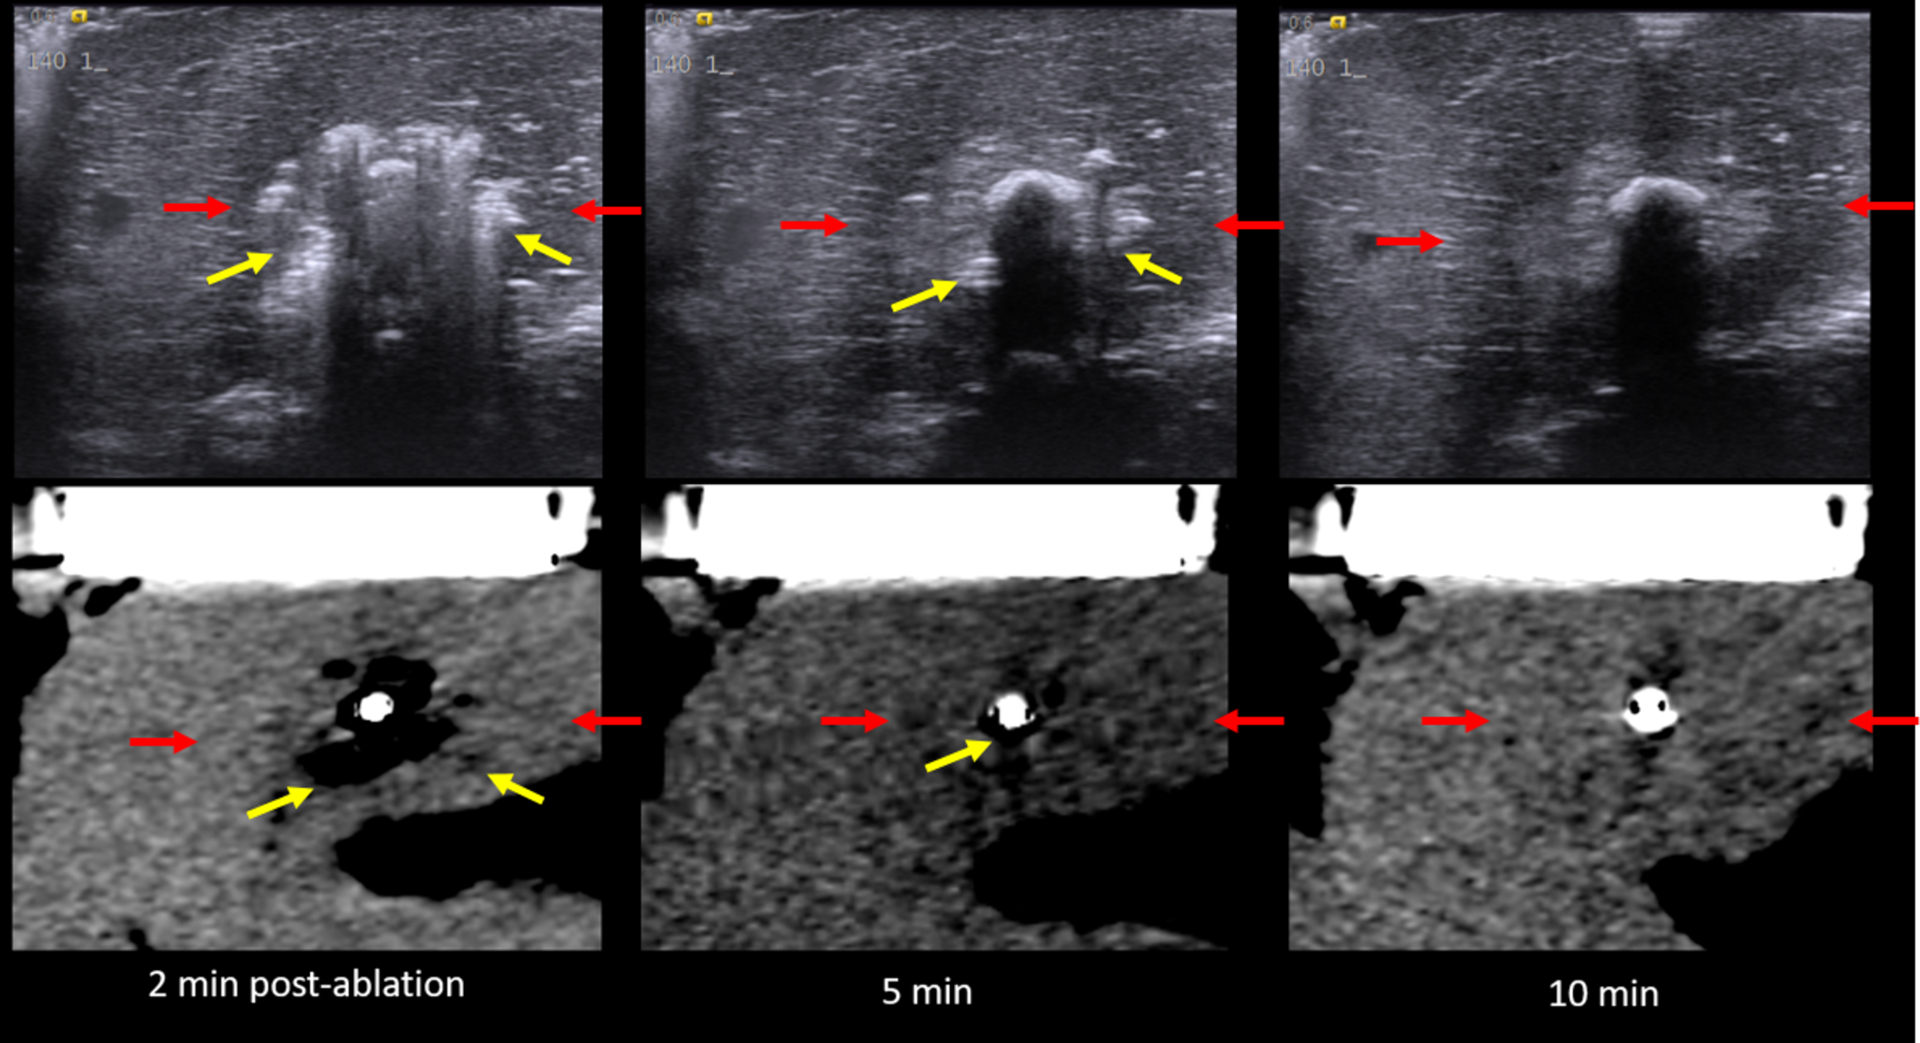
Figure 8:

US (top) vs. CT (bottom) images of the MW ablation zone post-procedure. Yellow arrows describe the zone of gas while red arrows indicate the hypoechoic/hypoattenuating zone. (note that the hypoattenuating zone is subtle on CT). Note the relatively rapid resolution of the zone of visible gas on both ultrasound and CT.
