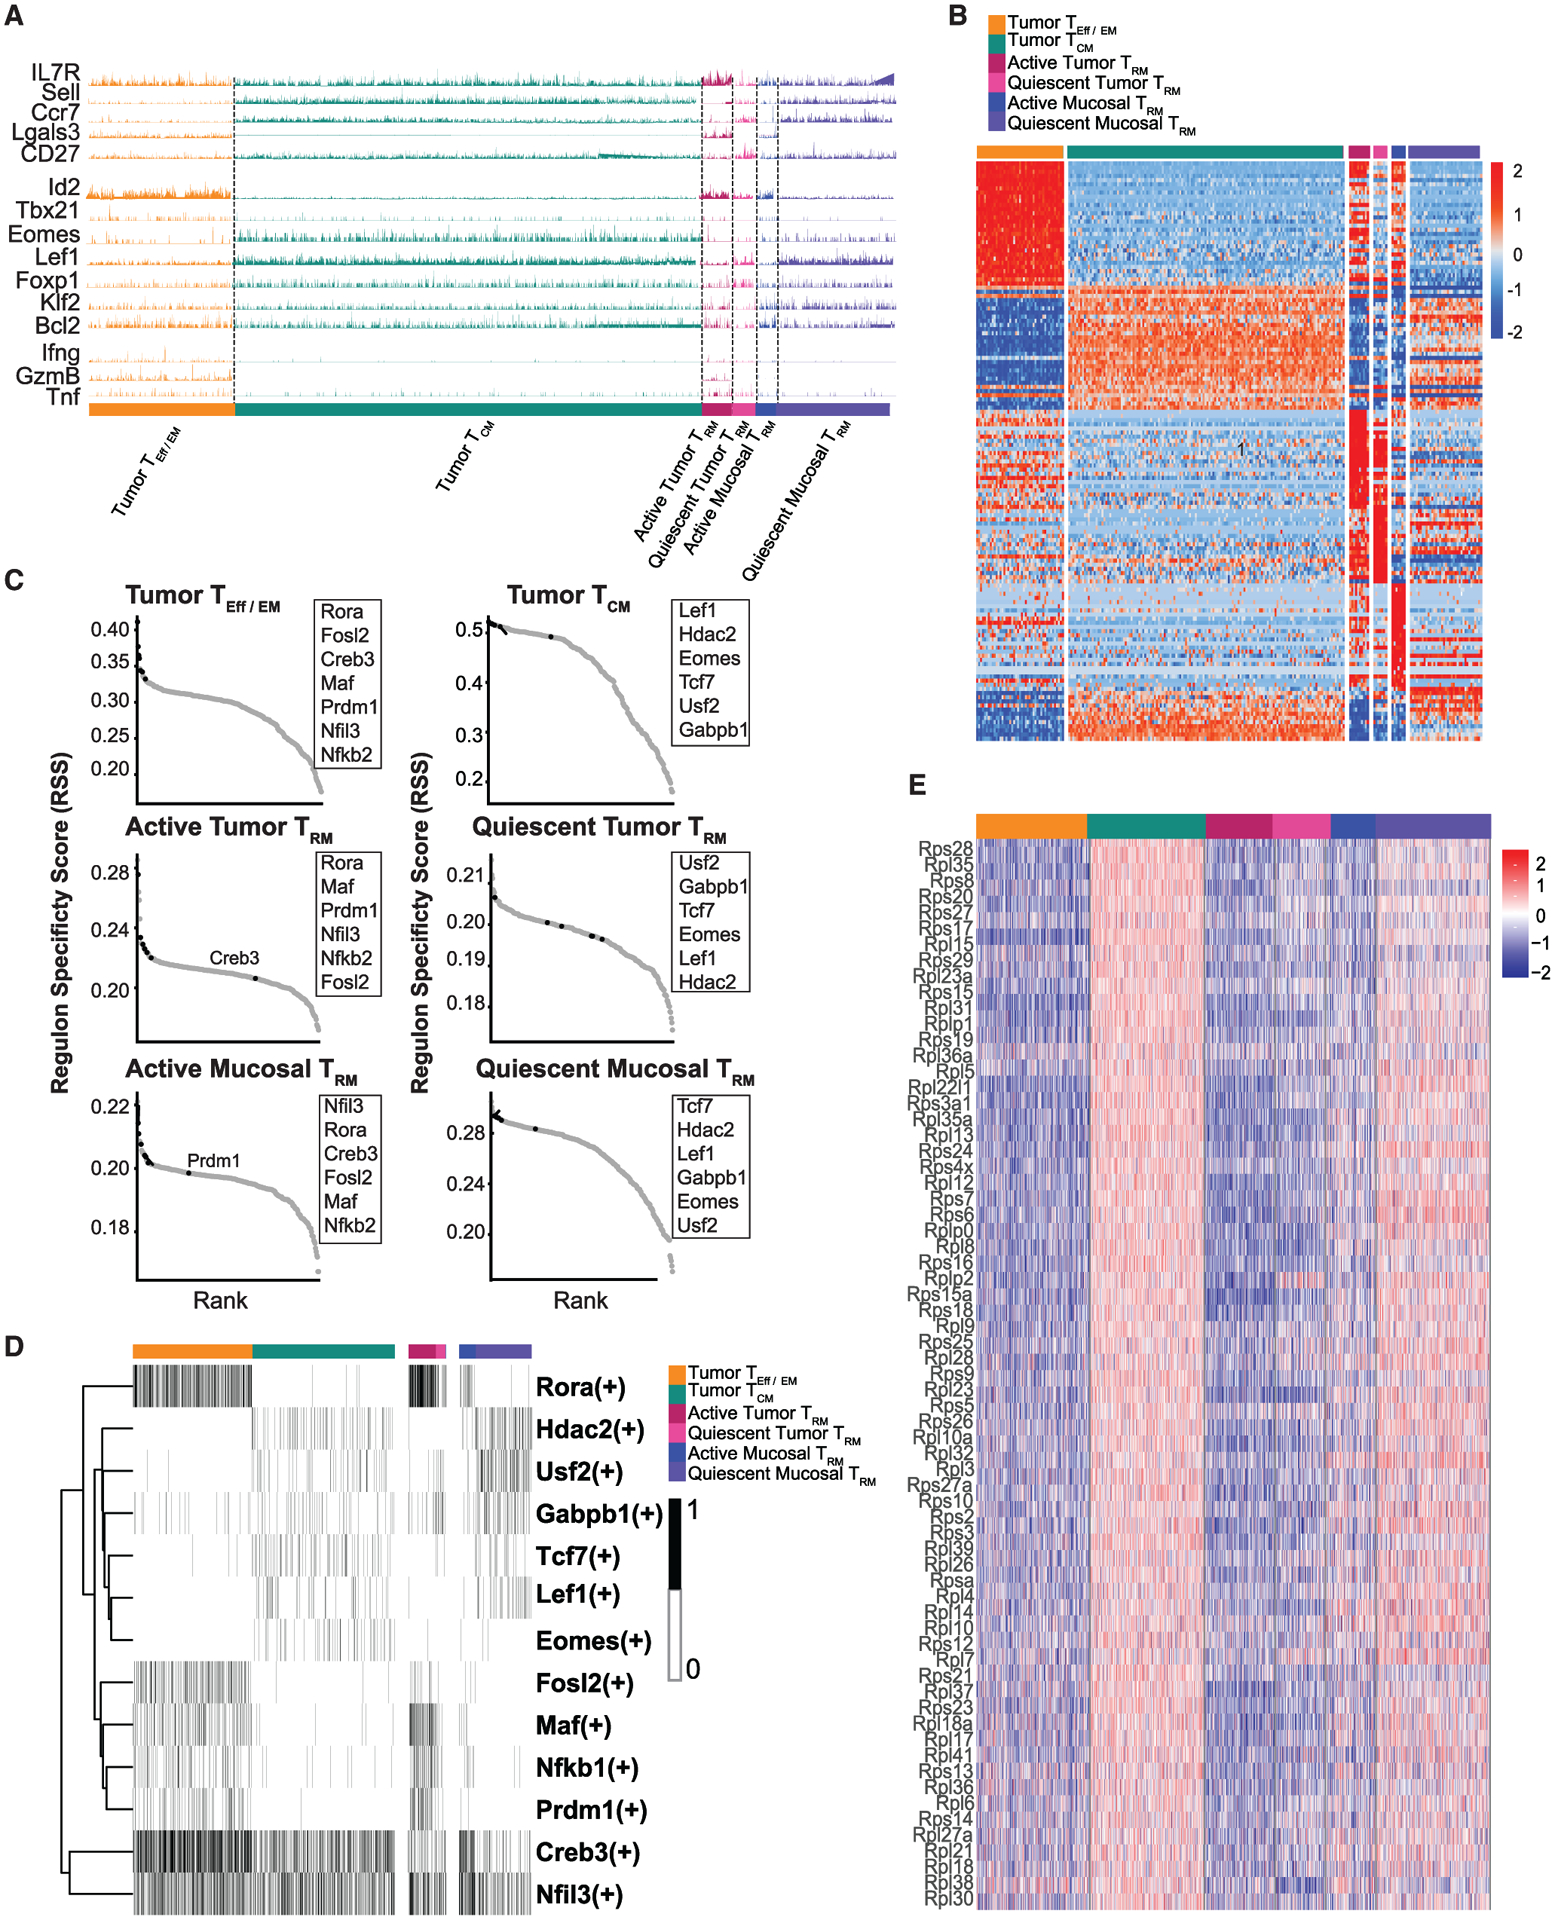
Figure 3. Two distinct subsets that resemble either TEMs or TCMscomprise tumor and distant mucosa TRMs.

(A) GeneTrac analysis of surface markers, transcription factors, and effector molecules among the major tumor TEff/EM, TCM, TRM, and distant TRM populations.
(B) Heatmap of top 100 DEGs between the tumor TEff/EM and tumor TCMs shows the global gene expression pattern between these circulating memory T cells and active and quiescent TRMs.
(C) SCENIC regulon analysis reveals an enrichment of the top regulons between tumor TEff/EM and active TRMs and between tumor TCMs and quiescent TRMs.
(D) Binary heatmap for top regulons is plotted for each cluster.
(E) A global enrichment of ribosome genes associates with tumor TCM and quiescent TRM subsets.
